Immigrants from Eastern Europe vs Dominican Hearing Disability
COMPARE
Immigrants from Eastern Europe
Dominican
Hearing Disability
Hearing Disability Comparison
Immigrants from Eastern Europe
Dominicans
3.0%
HEARING DISABILITY
58.1/ 100
METRIC RATING
167th/ 347
METRIC RANK
2.5%
HEARING DISABILITY
99.8/ 100
METRIC RATING
18th/ 347
METRIC RANK
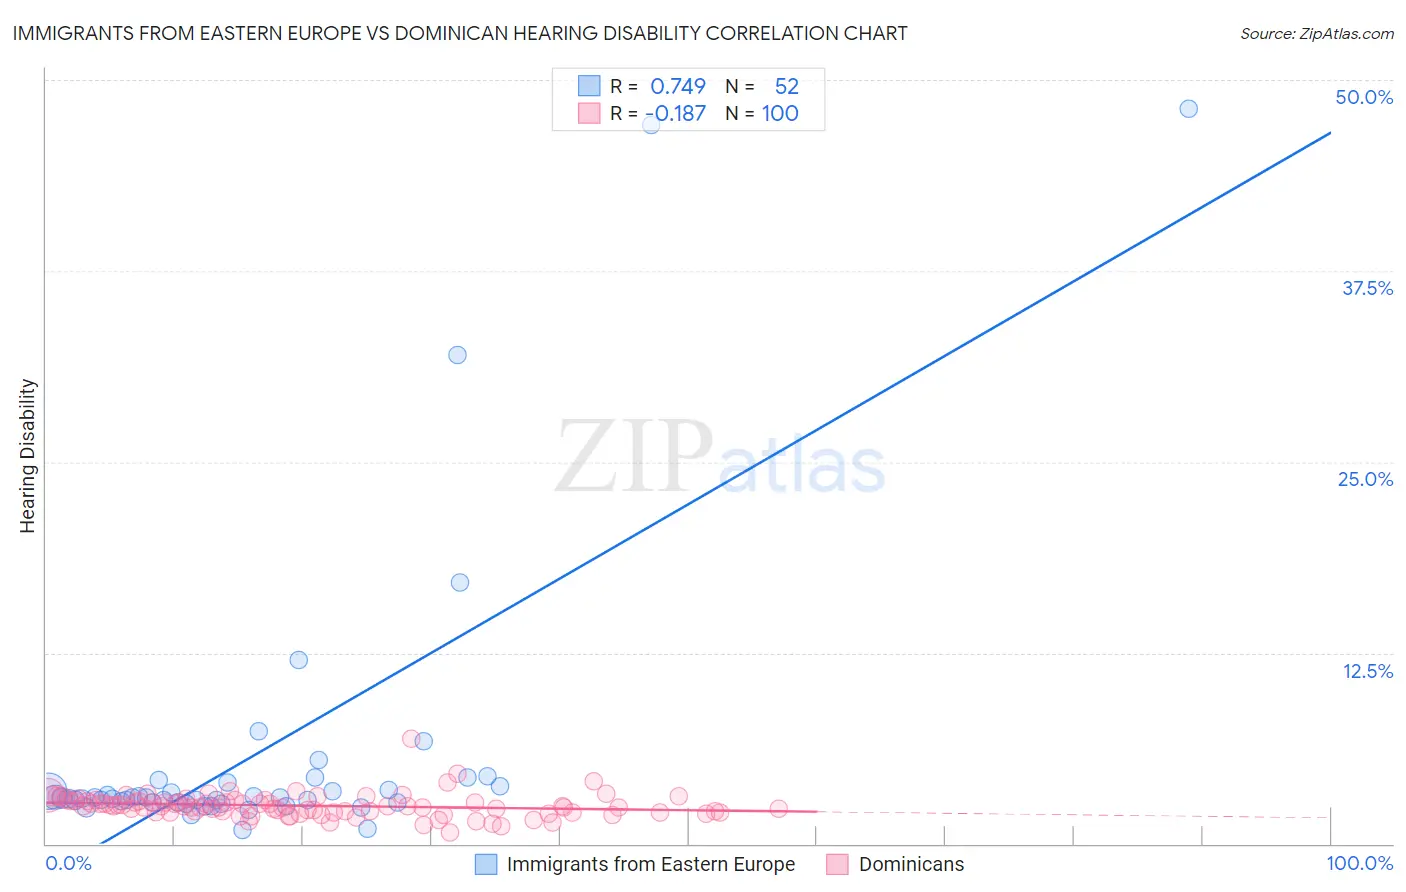
Immigrants from Eastern Europe vs Dominican Hearing Disability Correlation Chart
The statistical analysis conducted on geographies consisting of 475,611,830 people shows a strong positive correlation between the proportion of Immigrants from Eastern Europe and percentage of population with hearing disability in the United States with a correlation coefficient (R) of 0.749 and weighted average of 3.0%. Similarly, the statistical analysis conducted on geographies consisting of 354,884,530 people shows a poor negative correlation between the proportion of Dominicans and percentage of population with hearing disability in the United States with a correlation coefficient (R) of -0.187 and weighted average of 2.5%, a difference of 16.7%.
Hearing Disability Correlation Summary
| Measurement | Immigrants from Eastern Europe | Dominican |
| Minimum | 0.94% | 0.73% |
| Maximum | 48.1% | 6.8% |
| Range | 47.2% | 6.1% |
| Mean | 5.9% | 2.5% |
| Median | 3.0% | 2.4% |
| Interquartile 25% (IQ1) | 2.7% | 2.1% |
| Interquartile 75% (IQ3) | 3.9% | 2.8% |
| Interquartile Range (IQR) | 1.2% | 0.74% |
| Standard Deviation (Sample) | 9.6% | 0.77% |
| Standard Deviation (Population) | 9.5% | 0.76% |
Similar Demographics by Hearing Disability
Demographics Similar to Immigrants from Eastern Europe by Hearing Disability
In terms of hearing disability, the demographic groups most similar to Immigrants from Eastern Europe are Immigrants from Greece (3.0%, a difference of 0.020%), Arab (3.0%, a difference of 0.040%), Immigrants from Cabo Verde (3.0%, a difference of 0.11%), Immigrants from Ukraine (3.0%, a difference of 0.14%), and Armenian (3.0%, a difference of 0.20%).
| Demographics | Rating | Rank | Hearing Disability |
| Immigrants | Fiji | 67.1 /100 | #160 | Good 2.9% |
| Albanians | 66.6 /100 | #161 | Good 2.9% |
| Immigrants | Japan | 66.3 /100 | #162 | Good 2.9% |
| Immigrants | Central America | 64.9 /100 | #163 | Good 3.0% |
| Immigrants | Cambodia | 64.8 /100 | #164 | Good 3.0% |
| Immigrants | Zimbabwe | 64.2 /100 | #165 | Good 3.0% |
| Immigrants | South Eastern Asia | 62.9 /100 | #166 | Good 3.0% |
| Immigrants | Eastern Europe | 58.1 /100 | #167 | Average 3.0% |
| Immigrants | Greece | 57.9 /100 | #168 | Average 3.0% |
| Arabs | 57.6 /100 | #169 | Average 3.0% |
| Immigrants | Cabo Verde | 56.9 /100 | #170 | Average 3.0% |
| Immigrants | Ukraine | 56.6 /100 | #171 | Average 3.0% |
| Armenians | 56.0 /100 | #172 | Average 3.0% |
| Immigrants | Serbia | 51.1 /100 | #173 | Average 3.0% |
| Indonesians | 50.0 /100 | #174 | Average 3.0% |
Demographics Similar to Dominicans by Hearing Disability
In terms of hearing disability, the demographic groups most similar to Dominicans are Thai (2.5%, a difference of 0.030%), Immigrants from Bolivia (2.5%, a difference of 0.070%), Ghanaian (2.5%, a difference of 0.14%), Immigrants from Sierra Leone (2.6%, a difference of 0.18%), and Immigrants from Nigeria (2.6%, a difference of 0.68%).
| Demographics | Rating | Rank | Hearing Disability |
| Immigrants | Trinidad and Tobago | 99.9 /100 | #11 | Exceptional 2.5% |
| Trinidadians and Tobagonians | 99.9 /100 | #12 | Exceptional 2.5% |
| Sierra Leoneans | 99.9 /100 | #13 | Exceptional 2.5% |
| Ecuadorians | 99.9 /100 | #14 | Exceptional 2.5% |
| Barbadians | 99.9 /100 | #15 | Exceptional 2.5% |
| Immigrants | West Indies | 99.9 /100 | #16 | Exceptional 2.5% |
| Immigrants | India | 99.9 /100 | #17 | Exceptional 2.5% |
| Dominicans | 99.8 /100 | #18 | Exceptional 2.5% |
| Thais | 99.8 /100 | #19 | Exceptional 2.5% |
| Immigrants | Bolivia | 99.8 /100 | #20 | Exceptional 2.5% |
| Ghanaians | 99.8 /100 | #21 | Exceptional 2.5% |
| Immigrants | Sierra Leone | 99.8 /100 | #22 | Exceptional 2.6% |
| Immigrants | Nigeria | 99.8 /100 | #23 | Exceptional 2.6% |
| Immigrants | Ghana | 99.8 /100 | #24 | Exceptional 2.6% |
| Immigrants | El Salvador | 99.7 /100 | #25 | Exceptional 2.6% |