Turkish vs Dominican Hearing Disability
COMPARE
Turkish
Dominican
Hearing Disability
Hearing Disability Comparison
Turks
Dominicans
2.8%
HEARING DISABILITY
93.0/ 100
METRIC RATING
109th/ 347
METRIC RANK
2.5%
HEARING DISABILITY
99.8/ 100
METRIC RATING
18th/ 347
METRIC RANK
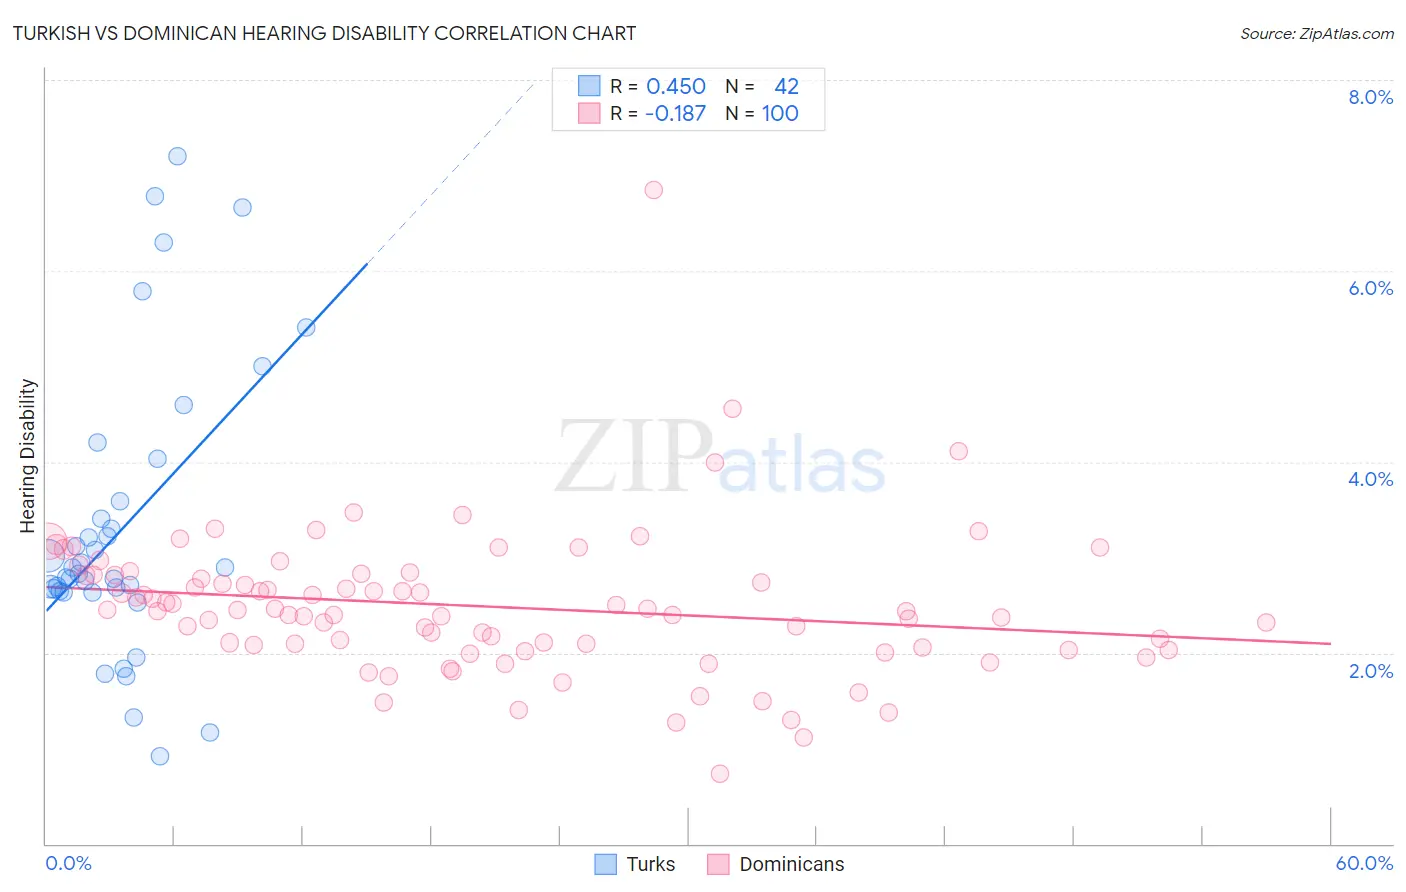
Turkish vs Dominican Hearing Disability Correlation Chart
The statistical analysis conducted on geographies consisting of 271,814,668 people shows a moderate positive correlation between the proportion of Turks and percentage of population with hearing disability in the United States with a correlation coefficient (R) of 0.450 and weighted average of 2.8%. Similarly, the statistical analysis conducted on geographies consisting of 354,884,530 people shows a poor negative correlation between the proportion of Dominicans and percentage of population with hearing disability in the United States with a correlation coefficient (R) of -0.187 and weighted average of 2.5%, a difference of 10.5%.
Hearing Disability Correlation Summary
| Measurement | Turkish | Dominican |
| Minimum | 0.92% | 0.73% |
| Maximum | 7.2% | 6.8% |
| Range | 6.3% | 6.1% |
| Mean | 3.3% | 2.5% |
| Median | 2.9% | 2.4% |
| Interquartile 25% (IQ1) | 2.7% | 2.1% |
| Interquartile 75% (IQ3) | 3.6% | 2.8% |
| Interquartile Range (IQR) | 0.93% | 0.74% |
| Standard Deviation (Sample) | 1.5% | 0.77% |
| Standard Deviation (Population) | 1.5% | 0.76% |
Similar Demographics by Hearing Disability
Demographics Similar to Turks by Hearing Disability
In terms of hearing disability, the demographic groups most similar to Turks are Cypriot (2.8%, a difference of 0.050%), Guatemalan (2.8%, a difference of 0.070%), Immigrants from Yemen (2.8%, a difference of 0.10%), Honduran (2.8%, a difference of 0.15%), and Immigrants from Chile (2.8%, a difference of 0.15%).
| Demographics | Rating | Rank | Hearing Disability |
| Taiwanese | 94.8 /100 | #102 | Exceptional 2.8% |
| Immigrants | Indonesia | 94.7 /100 | #103 | Exceptional 2.8% |
| Burmese | 94.2 /100 | #104 | Exceptional 2.8% |
| Moroccans | 93.9 /100 | #105 | Exceptional 2.8% |
| Hondurans | 93.4 /100 | #106 | Exceptional 2.8% |
| Immigrants | Chile | 93.4 /100 | #107 | Exceptional 2.8% |
| Guatemalans | 93.2 /100 | #108 | Exceptional 2.8% |
| Turks | 93.0 /100 | #109 | Exceptional 2.8% |
| Cypriots | 92.9 /100 | #110 | Exceptional 2.8% |
| Immigrants | Yemen | 92.7 /100 | #111 | Exceptional 2.8% |
| U.S. Virgin Islanders | 92.5 /100 | #112 | Exceptional 2.8% |
| Immigrants | Belarus | 91.6 /100 | #113 | Exceptional 2.8% |
| Cambodians | 91.1 /100 | #114 | Exceptional 2.8% |
| Immigrants | Latin America | 90.5 /100 | #115 | Exceptional 2.8% |
| Immigrants | Immigrants | 90.3 /100 | #116 | Exceptional 2.8% |
Demographics Similar to Dominicans by Hearing Disability
In terms of hearing disability, the demographic groups most similar to Dominicans are Thai (2.5%, a difference of 0.030%), Immigrants from Bolivia (2.5%, a difference of 0.070%), Ghanaian (2.5%, a difference of 0.14%), Immigrants from Sierra Leone (2.6%, a difference of 0.18%), and Immigrants from Nigeria (2.6%, a difference of 0.68%).
| Demographics | Rating | Rank | Hearing Disability |
| Immigrants | Trinidad and Tobago | 99.9 /100 | #11 | Exceptional 2.5% |
| Trinidadians and Tobagonians | 99.9 /100 | #12 | Exceptional 2.5% |
| Sierra Leoneans | 99.9 /100 | #13 | Exceptional 2.5% |
| Ecuadorians | 99.9 /100 | #14 | Exceptional 2.5% |
| Barbadians | 99.9 /100 | #15 | Exceptional 2.5% |
| Immigrants | West Indies | 99.9 /100 | #16 | Exceptional 2.5% |
| Immigrants | India | 99.9 /100 | #17 | Exceptional 2.5% |
| Dominicans | 99.8 /100 | #18 | Exceptional 2.5% |
| Thais | 99.8 /100 | #19 | Exceptional 2.5% |
| Immigrants | Bolivia | 99.8 /100 | #20 | Exceptional 2.5% |
| Ghanaians | 99.8 /100 | #21 | Exceptional 2.5% |
| Immigrants | Sierra Leone | 99.8 /100 | #22 | Exceptional 2.6% |
| Immigrants | Nigeria | 99.8 /100 | #23 | Exceptional 2.6% |
| Immigrants | Ghana | 99.8 /100 | #24 | Exceptional 2.6% |
| Immigrants | El Salvador | 99.7 /100 | #25 | Exceptional 2.6% |