Immigrants from Hong Kong vs Dominican Hearing Disability
COMPARE
Immigrants from Hong Kong
Dominican
Hearing Disability
Hearing Disability Comparison
Immigrants from Hong Kong
Dominicans
2.7%
HEARING DISABILITY
99.2/ 100
METRIC RATING
51st/ 347
METRIC RANK
2.5%
HEARING DISABILITY
99.8/ 100
METRIC RATING
18th/ 347
METRIC RANK
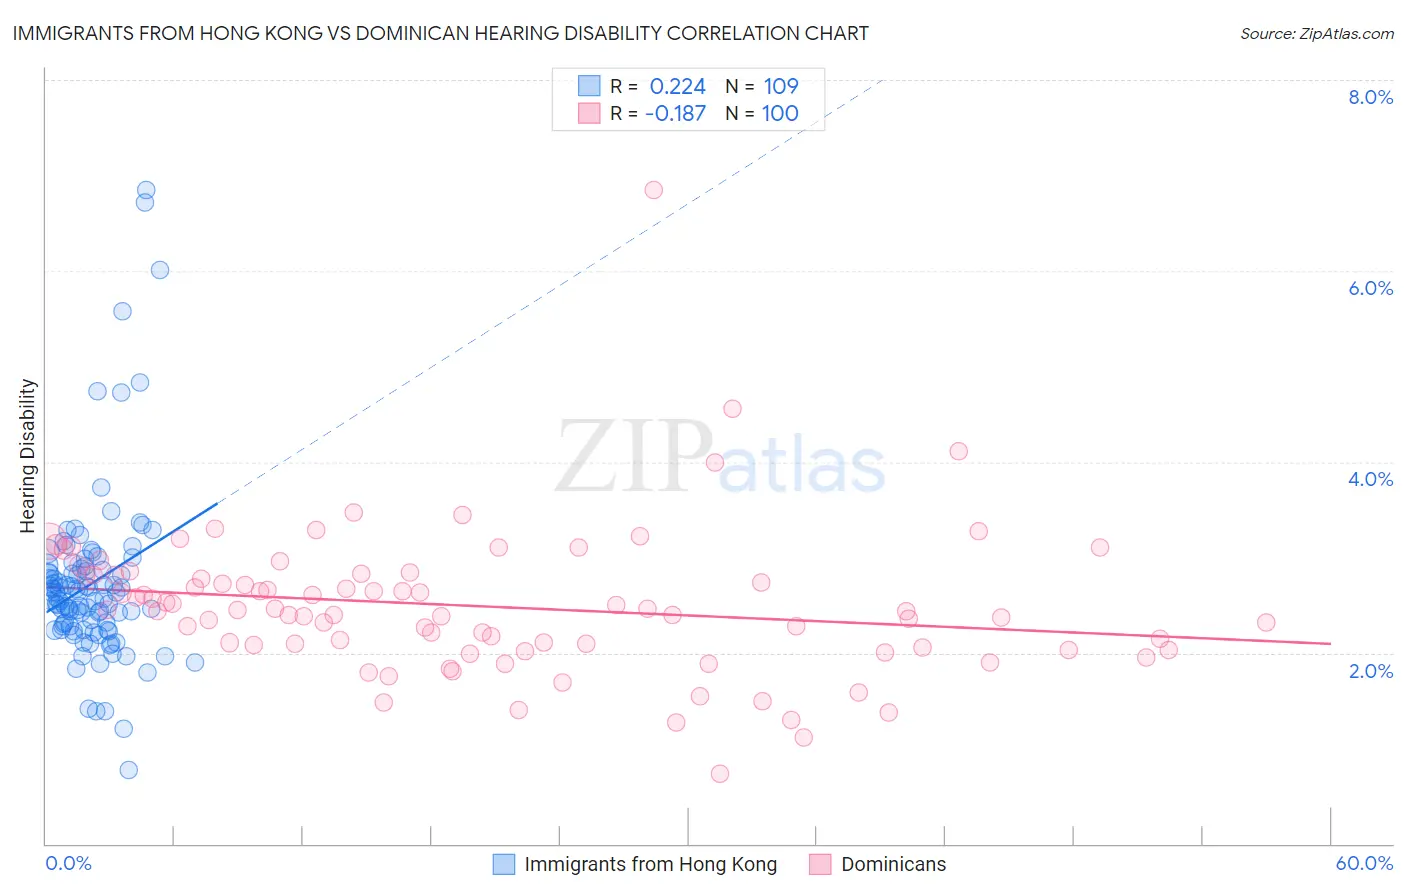
Immigrants from Hong Kong vs Dominican Hearing Disability Correlation Chart
The statistical analysis conducted on geographies consisting of 253,945,747 people shows a weak positive correlation between the proportion of Immigrants from Hong Kong and percentage of population with hearing disability in the United States with a correlation coefficient (R) of 0.224 and weighted average of 2.7%. Similarly, the statistical analysis conducted on geographies consisting of 354,884,530 people shows a poor negative correlation between the proportion of Dominicans and percentage of population with hearing disability in the United States with a correlation coefficient (R) of -0.187 and weighted average of 2.5%, a difference of 4.5%.
Hearing Disability Correlation Summary
| Measurement | Immigrants from Hong Kong | Dominican |
| Minimum | 0.77% | 0.73% |
| Maximum | 6.9% | 6.8% |
| Range | 6.1% | 6.1% |
| Mean | 2.7% | 2.5% |
| Median | 2.6% | 2.4% |
| Interquartile 25% (IQ1) | 2.3% | 2.1% |
| Interquartile 75% (IQ3) | 2.9% | 2.8% |
| Interquartile Range (IQR) | 0.63% | 0.74% |
| Standard Deviation (Sample) | 0.93% | 0.77% |
| Standard Deviation (Population) | 0.92% | 0.76% |
Similar Demographics by Hearing Disability
Demographics Similar to Immigrants from Hong Kong by Hearing Disability
In terms of hearing disability, the demographic groups most similar to Immigrants from Hong Kong are Paraguayan (2.7%, a difference of 0.070%), Immigrants from South America (2.7%, a difference of 0.26%), Jamaican (2.7%, a difference of 0.36%), Immigrants from Singapore (2.6%, a difference of 0.38%), and Immigrants from Eastern Asia (2.7%, a difference of 0.42%).
| Demographics | Rating | Rank | Hearing Disability |
| Nigerians | 99.4 /100 | #44 | Exceptional 2.6% |
| Venezuelans | 99.4 /100 | #45 | Exceptional 2.6% |
| Immigrants | Dominica | 99.3 /100 | #46 | Exceptional 2.6% |
| Immigrants | Israel | 99.3 /100 | #47 | Exceptional 2.6% |
| Immigrants | Singapore | 99.3 /100 | #48 | Exceptional 2.6% |
| Immigrants | South America | 99.2 /100 | #49 | Exceptional 2.7% |
| Paraguayans | 99.2 /100 | #50 | Exceptional 2.7% |
| Immigrants | Hong Kong | 99.2 /100 | #51 | Exceptional 2.7% |
| Jamaicans | 99.0 /100 | #52 | Exceptional 2.7% |
| Immigrants | Eastern Asia | 99.0 /100 | #53 | Exceptional 2.7% |
| Ethiopians | 99.0 /100 | #54 | Exceptional 2.7% |
| Immigrants | Ethiopia | 99.0 /100 | #55 | Exceptional 2.7% |
| Immigrants | Nicaragua | 99.0 /100 | #56 | Exceptional 2.7% |
| South Americans | 99.0 /100 | #57 | Exceptional 2.7% |
| Immigrants | Peru | 98.6 /100 | #58 | Exceptional 2.7% |
Demographics Similar to Dominicans by Hearing Disability
In terms of hearing disability, the demographic groups most similar to Dominicans are Thai (2.5%, a difference of 0.030%), Immigrants from Bolivia (2.5%, a difference of 0.070%), Ghanaian (2.5%, a difference of 0.14%), Immigrants from Sierra Leone (2.6%, a difference of 0.18%), and Immigrants from Nigeria (2.6%, a difference of 0.68%).
| Demographics | Rating | Rank | Hearing Disability |
| Immigrants | Trinidad and Tobago | 99.9 /100 | #11 | Exceptional 2.5% |
| Trinidadians and Tobagonians | 99.9 /100 | #12 | Exceptional 2.5% |
| Sierra Leoneans | 99.9 /100 | #13 | Exceptional 2.5% |
| Ecuadorians | 99.9 /100 | #14 | Exceptional 2.5% |
| Barbadians | 99.9 /100 | #15 | Exceptional 2.5% |
| Immigrants | West Indies | 99.9 /100 | #16 | Exceptional 2.5% |
| Immigrants | India | 99.9 /100 | #17 | Exceptional 2.5% |
| Dominicans | 99.8 /100 | #18 | Exceptional 2.5% |
| Thais | 99.8 /100 | #19 | Exceptional 2.5% |
| Immigrants | Bolivia | 99.8 /100 | #20 | Exceptional 2.5% |
| Ghanaians | 99.8 /100 | #21 | Exceptional 2.5% |
| Immigrants | Sierra Leone | 99.8 /100 | #22 | Exceptional 2.6% |
| Immigrants | Nigeria | 99.8 /100 | #23 | Exceptional 2.6% |
| Immigrants | Ghana | 99.8 /100 | #24 | Exceptional 2.6% |
| Immigrants | El Salvador | 99.7 /100 | #25 | Exceptional 2.6% |