Tongan vs Immigrants from Cabo Verde Hearing Disability
COMPARE
Tongan
Immigrants from Cabo Verde
Hearing Disability
Hearing Disability Comparison
Tongans
Immigrants from Cabo Verde
2.9%
HEARING DISABILITY
78.6/ 100
METRIC RATING
147th/ 347
METRIC RANK
3.0%
HEARING DISABILITY
56.9/ 100
METRIC RATING
170th/ 347
METRIC RANK
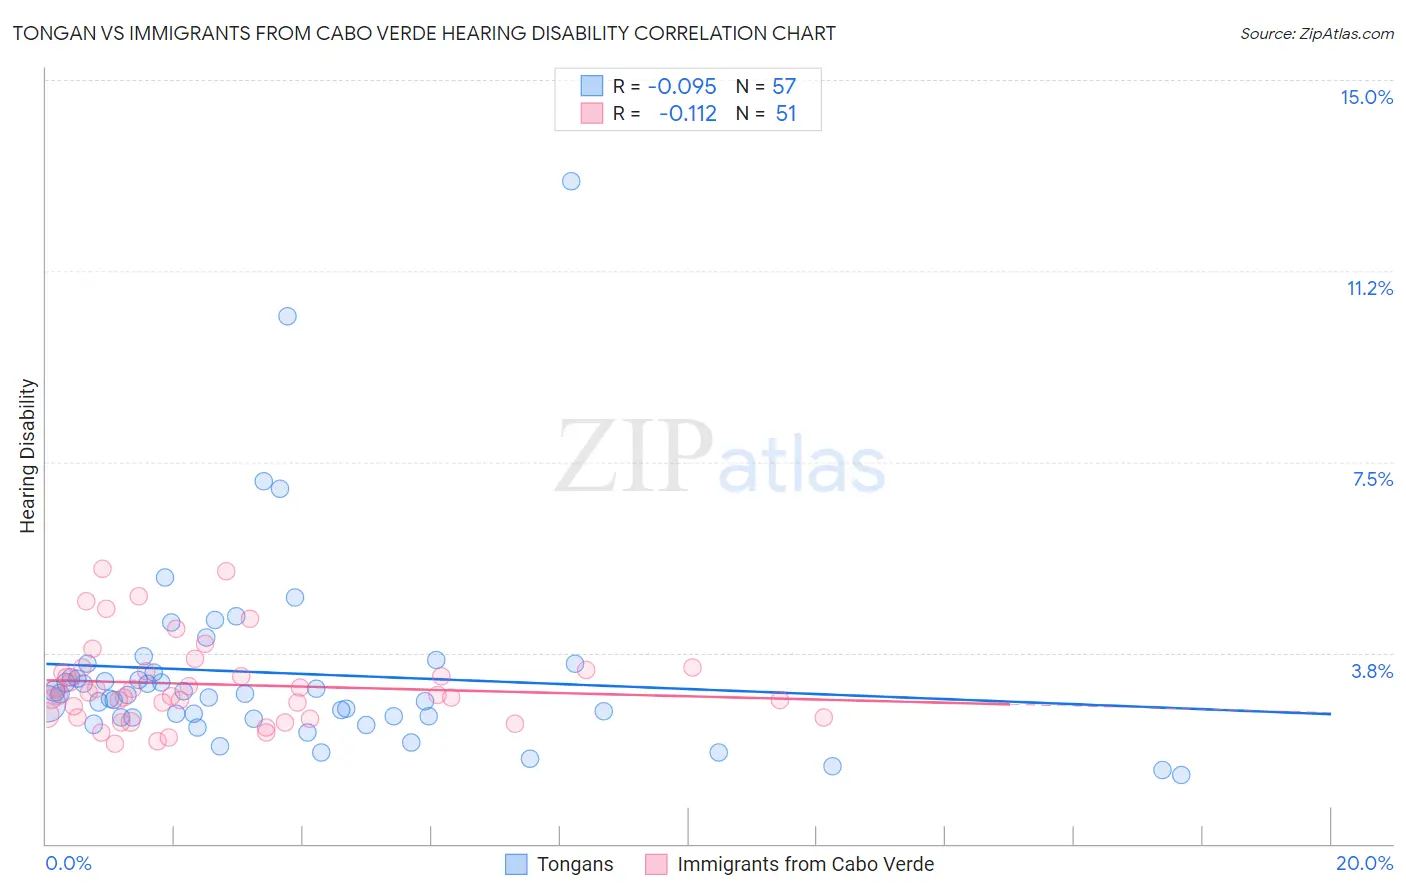
Tongan vs Immigrants from Cabo Verde Hearing Disability Correlation Chart
The statistical analysis conducted on geographies consisting of 102,876,442 people shows a slight negative correlation between the proportion of Tongans and percentage of population with hearing disability in the United States with a correlation coefficient (R) of -0.095 and weighted average of 2.9%. Similarly, the statistical analysis conducted on geographies consisting of 38,139,523 people shows a poor negative correlation between the proportion of Immigrants from Cabo Verde and percentage of population with hearing disability in the United States with a correlation coefficient (R) of -0.112 and weighted average of 3.0%, a difference of 2.5%.
Hearing Disability Correlation Summary
| Measurement | Tongan | Immigrants from Cabo Verde |
| Minimum | 1.4% | 2.0% |
| Maximum | 13.0% | 5.4% |
| Range | 11.7% | 3.4% |
| Mean | 3.3% | 3.1% |
| Median | 2.9% | 2.9% |
| Interquartile 25% (IQ1) | 2.5% | 2.5% |
| Interquartile 75% (IQ3) | 3.4% | 3.4% |
| Interquartile Range (IQR) | 0.97% | 0.92% |
| Standard Deviation (Sample) | 2.0% | 0.82% |
| Standard Deviation (Population) | 1.9% | 0.82% |
Similar Demographics by Hearing Disability
Demographics Similar to Tongans by Hearing Disability
In terms of hearing disability, the demographic groups most similar to Tongans are Brazilian (2.9%, a difference of 0.010%), Immigrants from Congo (2.9%, a difference of 0.030%), Immigrants from Bulgaria (2.9%, a difference of 0.080%), Immigrants from Russia (2.9%, a difference of 0.13%), and Immigrants from Panama (2.9%, a difference of 0.25%).
| Demographics | Rating | Rank | Hearing Disability |
| Immigrants | Jordan | 83.7 /100 | #140 | Excellent 2.9% |
| Sub-Saharan Africans | 83.3 /100 | #141 | Excellent 2.9% |
| Laotians | 81.1 /100 | #142 | Excellent 2.9% |
| Immigrants | Bahamas | 80.9 /100 | #143 | Excellent 2.9% |
| Immigrants | Bulgaria | 79.2 /100 | #144 | Good 2.9% |
| Immigrants | Congo | 78.9 /100 | #145 | Good 2.9% |
| Brazilians | 78.7 /100 | #146 | Good 2.9% |
| Tongans | 78.6 /100 | #147 | Good 2.9% |
| Immigrants | Russia | 77.7 /100 | #148 | Good 2.9% |
| Immigrants | Panama | 76.9 /100 | #149 | Good 2.9% |
| Palestinians | 73.6 /100 | #150 | Good 2.9% |
| Immigrants | France | 73.1 /100 | #151 | Good 2.9% |
| Immigrants | Lithuania | 73.0 /100 | #152 | Good 2.9% |
| Sudanese | 72.1 /100 | #153 | Good 2.9% |
| Immigrants | Lebanon | 71.5 /100 | #154 | Good 2.9% |
Demographics Similar to Immigrants from Cabo Verde by Hearing Disability
In terms of hearing disability, the demographic groups most similar to Immigrants from Cabo Verde are Immigrants from Ukraine (3.0%, a difference of 0.030%), Arab (3.0%, a difference of 0.070%), Armenian (3.0%, a difference of 0.090%), Immigrants from Greece (3.0%, a difference of 0.10%), and Immigrants from Eastern Europe (3.0%, a difference of 0.11%).
| Demographics | Rating | Rank | Hearing Disability |
| Immigrants | Central America | 64.9 /100 | #163 | Good 3.0% |
| Immigrants | Cambodia | 64.8 /100 | #164 | Good 3.0% |
| Immigrants | Zimbabwe | 64.2 /100 | #165 | Good 3.0% |
| Immigrants | South Eastern Asia | 62.9 /100 | #166 | Good 3.0% |
| Immigrants | Eastern Europe | 58.1 /100 | #167 | Average 3.0% |
| Immigrants | Greece | 57.9 /100 | #168 | Average 3.0% |
| Arabs | 57.6 /100 | #169 | Average 3.0% |
| Immigrants | Cabo Verde | 56.9 /100 | #170 | Average 3.0% |
| Immigrants | Ukraine | 56.6 /100 | #171 | Average 3.0% |
| Armenians | 56.0 /100 | #172 | Average 3.0% |
| Immigrants | Serbia | 51.1 /100 | #173 | Average 3.0% |
| Indonesians | 50.0 /100 | #174 | Average 3.0% |
| Immigrants | Romania | 48.4 /100 | #175 | Average 3.0% |
| Panamanians | 47.0 /100 | #176 | Average 3.0% |
| Immigrants | Philippines | 46.4 /100 | #177 | Average 3.0% |