Osage vs Dominican Hearing Disability
COMPARE
Osage
Dominican
Hearing Disability
Hearing Disability Comparison
Osage
Dominicans
4.1%
HEARING DISABILITY
0.0/ 100
METRIC RATING
324th/ 347
METRIC RANK
2.5%
HEARING DISABILITY
99.8/ 100
METRIC RATING
18th/ 347
METRIC RANK
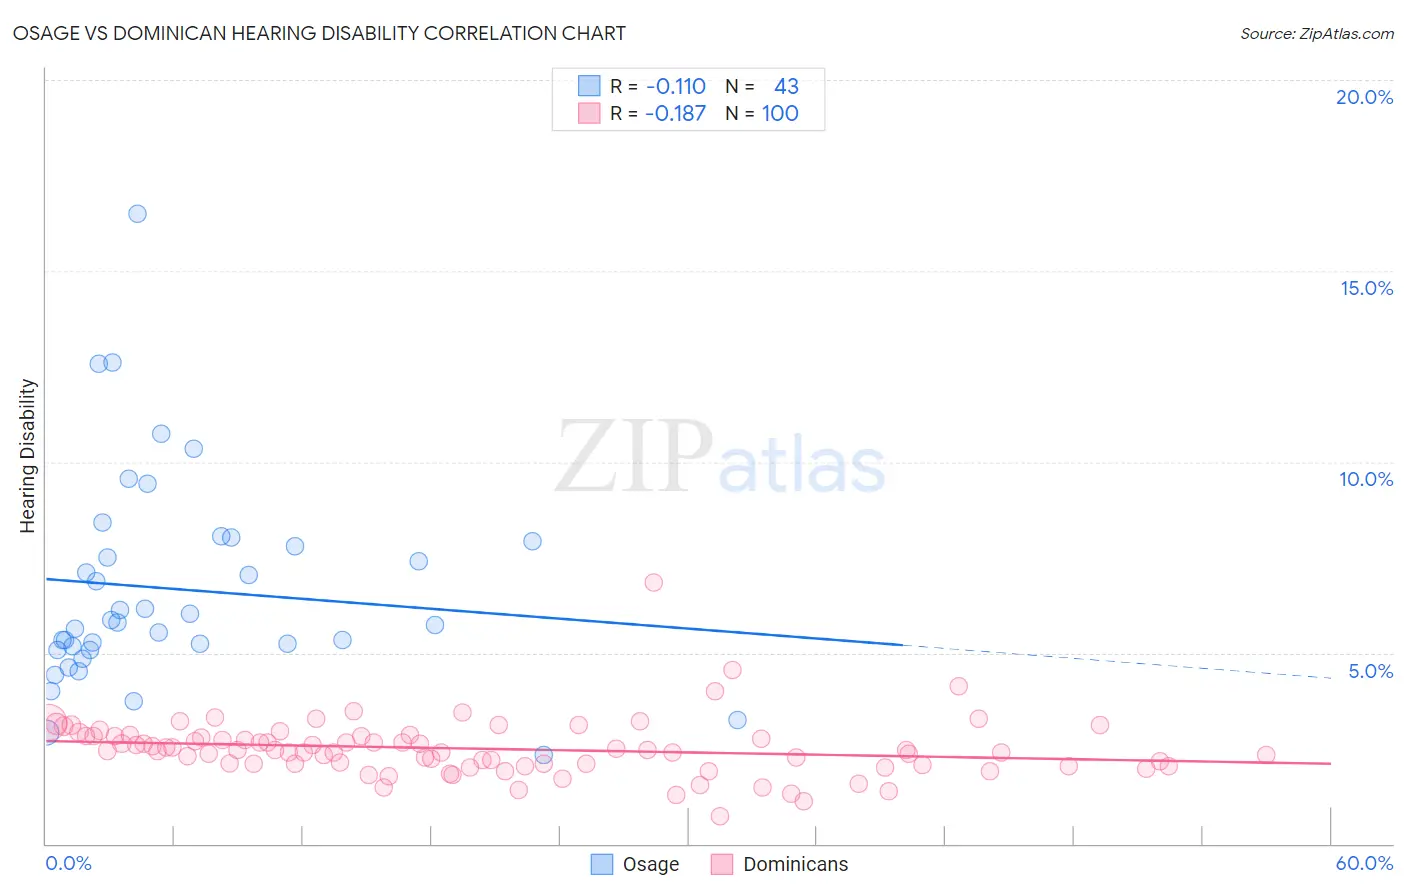
Osage vs Dominican Hearing Disability Correlation Chart
The statistical analysis conducted on geographies consisting of 91,798,863 people shows a poor negative correlation between the proportion of Osage and percentage of population with hearing disability in the United States with a correlation coefficient (R) of -0.110 and weighted average of 4.1%. Similarly, the statistical analysis conducted on geographies consisting of 354,884,530 people shows a poor negative correlation between the proportion of Dominicans and percentage of population with hearing disability in the United States with a correlation coefficient (R) of -0.187 and weighted average of 2.5%, a difference of 60.8%.
Hearing Disability Correlation Summary
| Measurement | Osage | Dominican |
| Minimum | 2.3% | 0.73% |
| Maximum | 16.5% | 6.8% |
| Range | 14.2% | 6.1% |
| Mean | 6.7% | 2.5% |
| Median | 5.8% | 2.4% |
| Interquartile 25% (IQ1) | 5.1% | 2.1% |
| Interquartile 75% (IQ3) | 7.9% | 2.8% |
| Interquartile Range (IQR) | 2.8% | 0.74% |
| Standard Deviation (Sample) | 2.8% | 0.77% |
| Standard Deviation (Population) | 2.8% | 0.76% |
Similar Demographics by Hearing Disability
Demographics Similar to Osage by Hearing Disability
In terms of hearing disability, the demographic groups most similar to Osage are Apache (4.1%, a difference of 0.070%), Seminole (4.1%, a difference of 0.19%), Lumbee (4.1%, a difference of 0.32%), Paiute (4.1%, a difference of 0.45%), and Potawatomi (4.1%, a difference of 0.61%).
| Demographics | Rating | Rank | Hearing Disability |
| Comanche | 0.0 /100 | #317 | Tragic 4.0% |
| Cheyenne | 0.0 /100 | #318 | Tragic 4.0% |
| Chippewa | 0.0 /100 | #319 | Tragic 4.0% |
| Shoshone | 0.0 /100 | #320 | Tragic 4.0% |
| Paiute | 0.0 /100 | #321 | Tragic 4.1% |
| Seminole | 0.0 /100 | #322 | Tragic 4.1% |
| Apache | 0.0 /100 | #323 | Tragic 4.1% |
| Osage | 0.0 /100 | #324 | Tragic 4.1% |
| Lumbee | 0.0 /100 | #325 | Tragic 4.1% |
| Potawatomi | 0.0 /100 | #326 | Tragic 4.1% |
| Arapaho | 0.0 /100 | #327 | Tragic 4.1% |
| Tohono O'odham | 0.0 /100 | #328 | Tragic 4.2% |
| Crow | 0.0 /100 | #329 | Tragic 4.2% |
| Natives/Alaskans | 0.0 /100 | #330 | Tragic 4.2% |
| Cherokee | 0.0 /100 | #331 | Tragic 4.2% |
Demographics Similar to Dominicans by Hearing Disability
In terms of hearing disability, the demographic groups most similar to Dominicans are Thai (2.5%, a difference of 0.030%), Immigrants from Bolivia (2.5%, a difference of 0.070%), Ghanaian (2.5%, a difference of 0.14%), Immigrants from Sierra Leone (2.6%, a difference of 0.18%), and Immigrants from Nigeria (2.6%, a difference of 0.68%).
| Demographics | Rating | Rank | Hearing Disability |
| Immigrants | Trinidad and Tobago | 99.9 /100 | #11 | Exceptional 2.5% |
| Trinidadians and Tobagonians | 99.9 /100 | #12 | Exceptional 2.5% |
| Sierra Leoneans | 99.9 /100 | #13 | Exceptional 2.5% |
| Ecuadorians | 99.9 /100 | #14 | Exceptional 2.5% |
| Barbadians | 99.9 /100 | #15 | Exceptional 2.5% |
| Immigrants | West Indies | 99.9 /100 | #16 | Exceptional 2.5% |
| Immigrants | India | 99.9 /100 | #17 | Exceptional 2.5% |
| Dominicans | 99.8 /100 | #18 | Exceptional 2.5% |
| Thais | 99.8 /100 | #19 | Exceptional 2.5% |
| Immigrants | Bolivia | 99.8 /100 | #20 | Exceptional 2.5% |
| Ghanaians | 99.8 /100 | #21 | Exceptional 2.5% |
| Immigrants | Sierra Leone | 99.8 /100 | #22 | Exceptional 2.6% |
| Immigrants | Nigeria | 99.8 /100 | #23 | Exceptional 2.6% |
| Immigrants | Ghana | 99.8 /100 | #24 | Exceptional 2.6% |
| Immigrants | El Salvador | 99.7 /100 | #25 | Exceptional 2.6% |