Tongan vs Immigrants from Jamaica Cognitive Disability
COMPARE
Tongan
Immigrants from Jamaica
Cognitive Disability
Cognitive Disability Comparison
Tongans
Immigrants from Jamaica
17.8%
COGNITIVE DISABILITY
2.1/ 100
METRIC RATING
232nd/ 347
METRIC RANK
17.6%
COGNITIVE DISABILITY
8.5/ 100
METRIC RATING
210th/ 347
METRIC RANK
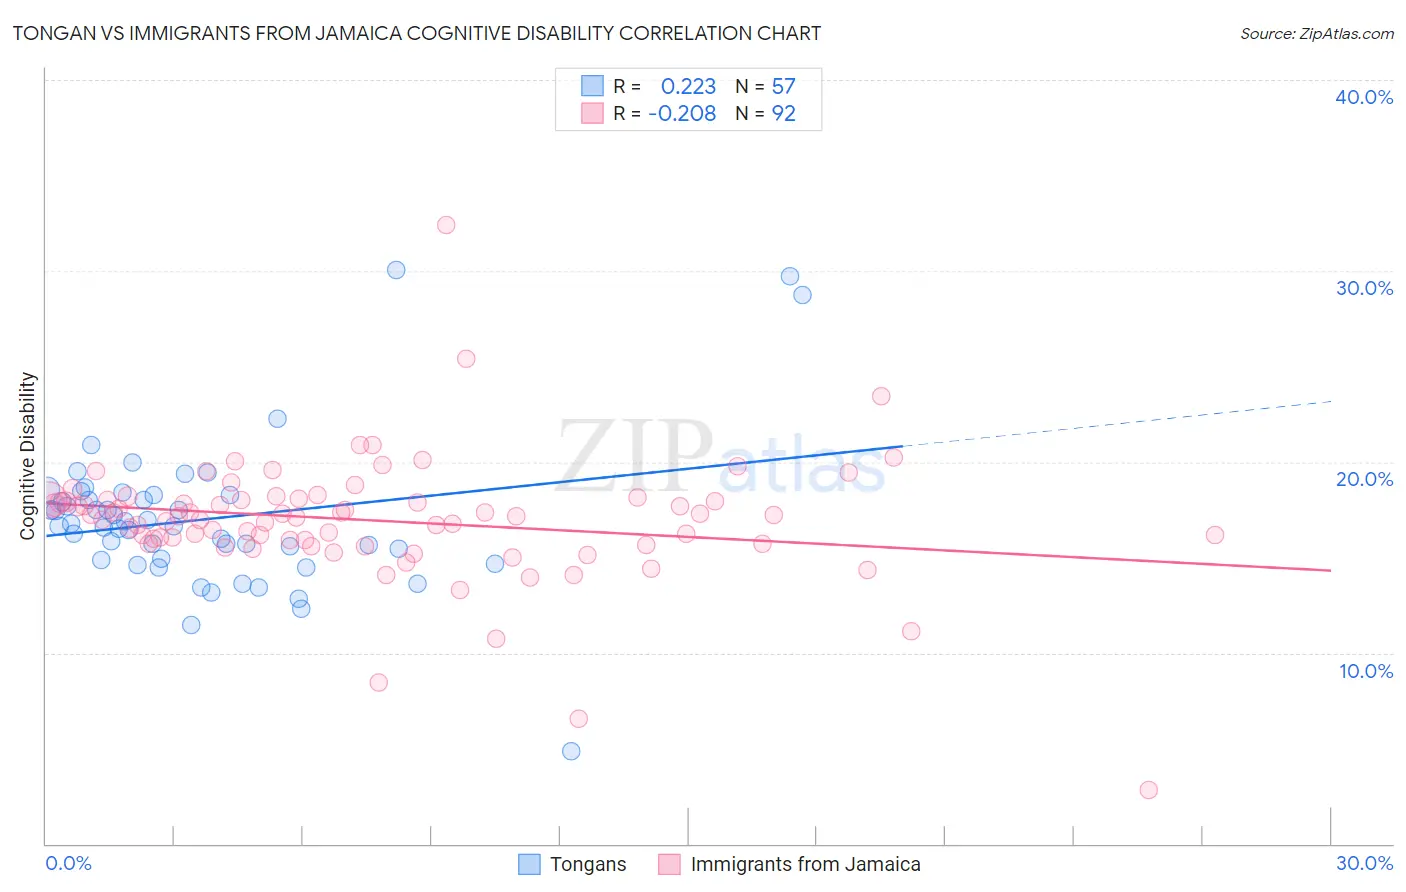
Tongan vs Immigrants from Jamaica Cognitive Disability Correlation Chart
The statistical analysis conducted on geographies consisting of 102,895,026 people shows a weak positive correlation between the proportion of Tongans and percentage of population with cognitive disability in the United States with a correlation coefficient (R) of 0.223 and weighted average of 17.8%. Similarly, the statistical analysis conducted on geographies consisting of 301,744,234 people shows a weak negative correlation between the proportion of Immigrants from Jamaica and percentage of population with cognitive disability in the United States with a correlation coefficient (R) of -0.208 and weighted average of 17.6%, a difference of 1.0%.
Cognitive Disability Correlation Summary
| Measurement | Tongan | Immigrants from Jamaica |
| Minimum | 4.8% | 2.8% |
| Maximum | 30.0% | 32.4% |
| Range | 25.2% | 29.6% |
| Mean | 17.0% | 16.9% |
| Median | 16.6% | 17.2% |
| Interquartile 25% (IQ1) | 14.9% | 15.8% |
| Interquartile 75% (IQ3) | 18.3% | 18.0% |
| Interquartile Range (IQR) | 3.4% | 2.2% |
| Standard Deviation (Sample) | 4.0% | 3.4% |
| Standard Deviation (Population) | 3.9% | 3.4% |
Similar Demographics by Cognitive Disability
Demographics Similar to Tongans by Cognitive Disability
In terms of cognitive disability, the demographic groups most similar to Tongans are Guatemalan (17.8%, a difference of 0.0%), Panamanian (17.8%, a difference of 0.0%), Osage (17.8%, a difference of 0.020%), Spanish American Indian (17.8%, a difference of 0.020%), and Mongolian (17.7%, a difference of 0.030%).
| Demographics | Rating | Rank | Cognitive Disability |
| Vietnamese | 3.4 /100 | #225 | Tragic 17.7% |
| Marshallese | 2.7 /100 | #226 | Tragic 17.7% |
| Immigrants | St. Vincent and the Grenadines | 2.6 /100 | #227 | Tragic 17.7% |
| Immigrants | Central America | 2.3 /100 | #228 | Tragic 17.7% |
| Immigrants | Guatemala | 2.2 /100 | #229 | Tragic 17.7% |
| Mongolians | 2.2 /100 | #230 | Tragic 17.7% |
| Guatemalans | 2.1 /100 | #231 | Tragic 17.8% |
| Tongans | 2.1 /100 | #232 | Tragic 17.8% |
| Panamanians | 2.1 /100 | #233 | Tragic 17.8% |
| Osage | 2.0 /100 | #234 | Tragic 17.8% |
| Spanish American Indians | 2.0 /100 | #235 | Tragic 17.8% |
| Immigrants | Iraq | 1.8 /100 | #236 | Tragic 17.8% |
| Immigrants | Mexico | 1.8 /100 | #237 | Tragic 17.8% |
| Cheyenne | 1.7 /100 | #238 | Tragic 17.8% |
| Cajuns | 1.4 /100 | #239 | Tragic 17.8% |
Demographics Similar to Immigrants from Jamaica by Cognitive Disability
In terms of cognitive disability, the demographic groups most similar to Immigrants from Jamaica are Immigrants from Trinidad and Tobago (17.6%, a difference of 0.020%), Immigrants from Cameroon (17.6%, a difference of 0.070%), Taiwanese (17.6%, a difference of 0.070%), Immigrants from Latin America (17.6%, a difference of 0.10%), and Immigrants from Oceania (17.6%, a difference of 0.11%).
| Demographics | Rating | Rank | Cognitive Disability |
| Immigrants | Caribbean | 11.0 /100 | #203 | Poor 17.5% |
| Immigrants | Zimbabwe | 11.0 /100 | #204 | Poor 17.5% |
| Puget Sound Salish | 10.9 /100 | #205 | Poor 17.5% |
| Alaska Natives | 10.4 /100 | #206 | Poor 17.5% |
| Immigrants | Latin America | 9.7 /100 | #207 | Tragic 17.6% |
| Immigrants | Cameroon | 9.3 /100 | #208 | Tragic 17.6% |
| Immigrants | Trinidad and Tobago | 8.7 /100 | #209 | Tragic 17.6% |
| Immigrants | Jamaica | 8.5 /100 | #210 | Tragic 17.6% |
| Taiwanese | 7.7 /100 | #211 | Tragic 17.6% |
| Immigrants | Oceania | 7.3 /100 | #212 | Tragic 17.6% |
| Hawaiians | 7.2 /100 | #213 | Tragic 17.6% |
| Immigrants | El Salvador | 7.0 /100 | #214 | Tragic 17.6% |
| Alaskan Athabascans | 6.9 /100 | #215 | Tragic 17.6% |
| Okinawans | 6.8 /100 | #216 | Tragic 17.6% |
| Salvadorans | 6.7 /100 | #217 | Tragic 17.6% |