Tongan vs Chilean Bachelor's Degree
COMPARE
Tongan
Chilean
Bachelor's Degree
Bachelor's Degree Comparison
Tongans
Chileans
34.3%
BACHELOR'S DEGREE
2.0/ 100
METRIC RATING
240th/ 347
METRIC RANK
41.2%
BACHELOR'S DEGREE
97.5/ 100
METRIC RATING
103rd/ 347
METRIC RANK
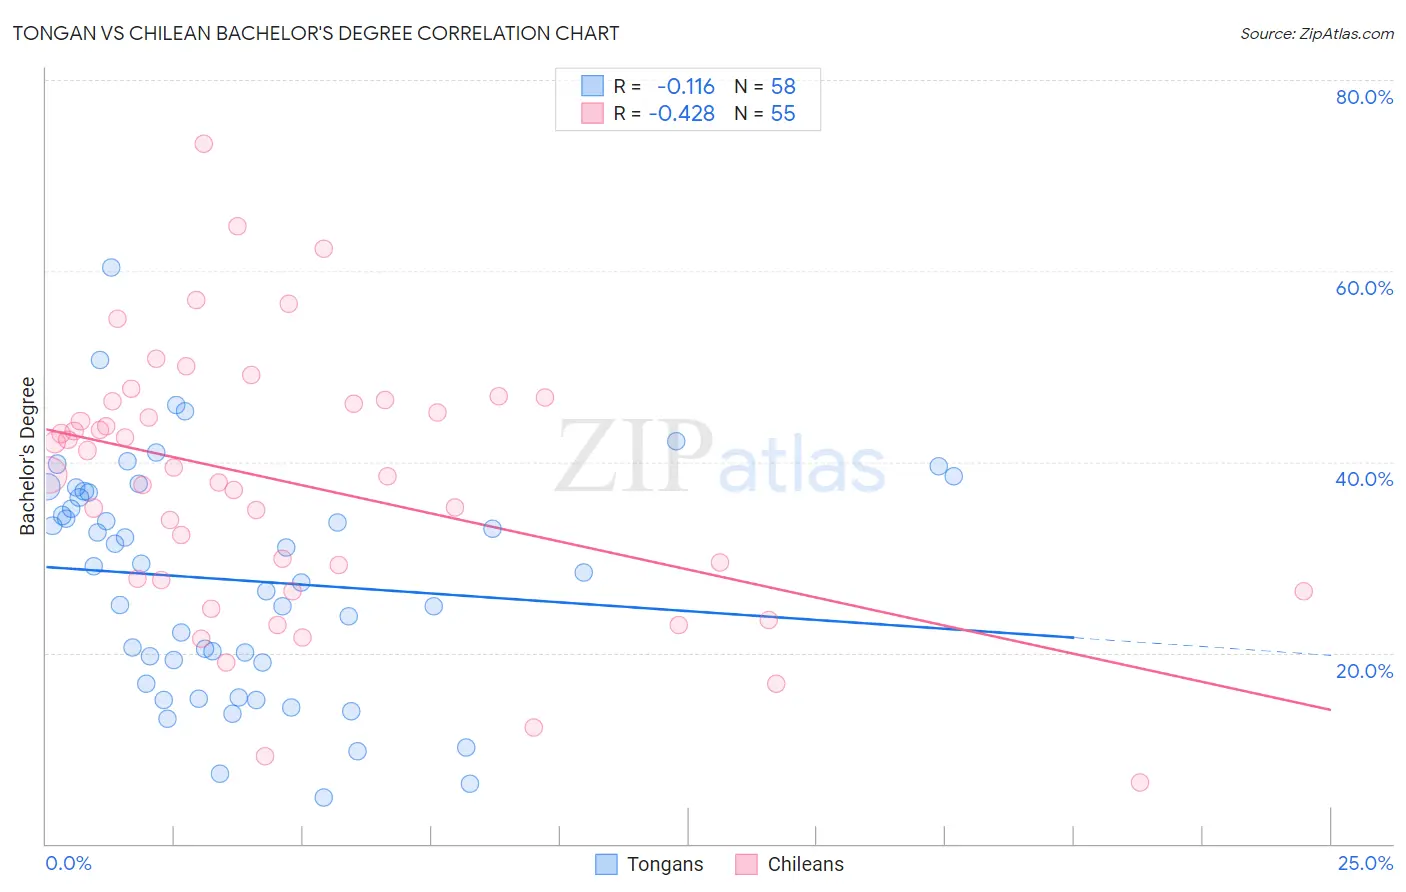
Tongan vs Chilean Bachelor's Degree Correlation Chart
The statistical analysis conducted on geographies consisting of 102,908,079 people shows a poor negative correlation between the proportion of Tongans and percentage of population with at least bachelor's degree education in the United States with a correlation coefficient (R) of -0.116 and weighted average of 34.3%. Similarly, the statistical analysis conducted on geographies consisting of 256,683,612 people shows a moderate negative correlation between the proportion of Chileans and percentage of population with at least bachelor's degree education in the United States with a correlation coefficient (R) of -0.428 and weighted average of 41.2%, a difference of 20.2%.
Bachelor's Degree Correlation Summary
| Measurement | Tongan | Chilean |
| Minimum | 4.8% | 6.5% |
| Maximum | 60.4% | 73.3% |
| Range | 55.6% | 66.8% |
| Mean | 27.6% | 37.7% |
| Median | 28.7% | 38.6% |
| Interquartile 25% (IQ1) | 19.0% | 27.6% |
| Interquartile 75% (IQ3) | 36.8% | 46.4% |
| Interquartile Range (IQR) | 17.8% | 18.7% |
| Standard Deviation (Sample) | 11.9% | 13.7% |
| Standard Deviation (Population) | 11.8% | 13.6% |
Similar Demographics by Bachelor's Degree
Demographics Similar to Tongans by Bachelor's Degree
In terms of bachelor's degree, the demographic groups most similar to Tongans are Immigrants from Cambodia (34.2%, a difference of 0.26%), Nonimmigrants (34.2%, a difference of 0.33%), British West Indian (34.5%, a difference of 0.54%), Guyanese (34.5%, a difference of 0.56%), and Tlingit-Haida (34.6%, a difference of 0.84%).
| Demographics | Rating | Rank | Bachelor's Degree |
| Immigrants | Ecuador | 3.3 /100 | #233 | Tragic 34.7% |
| Guamanians/Chamorros | 3.0 /100 | #234 | Tragic 34.6% |
| Immigrants | West Indies | 2.9 /100 | #235 | Tragic 34.6% |
| Liberians | 2.8 /100 | #236 | Tragic 34.6% |
| Tlingit-Haida | 2.8 /100 | #237 | Tragic 34.6% |
| Guyanese | 2.5 /100 | #238 | Tragic 34.5% |
| British West Indians | 2.5 /100 | #239 | Tragic 34.5% |
| Tongans | 2.0 /100 | #240 | Tragic 34.3% |
| Immigrants | Cambodia | 1.9 /100 | #241 | Tragic 34.2% |
| Immigrants | Nonimmigrants | 1.8 /100 | #242 | Tragic 34.2% |
| Immigrants | Guyana | 1.4 /100 | #243 | Tragic 33.9% |
| Delaware | 1.2 /100 | #244 | Tragic 33.8% |
| Immigrants | Fiji | 1.2 /100 | #245 | Tragic 33.7% |
| Jamaicans | 1.0 /100 | #246 | Tragic 33.6% |
| Immigrants | Congo | 1.0 /100 | #247 | Tragic 33.6% |
Demographics Similar to Chileans by Bachelor's Degree
In terms of bachelor's degree, the demographic groups most similar to Chileans are Jordanian (41.2%, a difference of 0.060%), Syrian (41.1%, a difference of 0.090%), Immigrants from Italy (41.3%, a difference of 0.34%), Alsatian (41.0%, a difference of 0.35%), and Northern European (41.0%, a difference of 0.52%).
| Demographics | Rating | Rank | Bachelor's Degree |
| Immigrants | Moldova | 98.4 /100 | #96 | Exceptional 41.6% |
| Romanians | 98.4 /100 | #97 | Exceptional 41.6% |
| Immigrants | Ukraine | 98.3 /100 | #98 | Exceptional 41.5% |
| Immigrants | England | 98.1 /100 | #99 | Exceptional 41.4% |
| Macedonians | 98.1 /100 | #100 | Exceptional 41.4% |
| Immigrants | Morocco | 98.0 /100 | #101 | Exceptional 41.4% |
| Immigrants | Italy | 97.8 /100 | #102 | Exceptional 41.3% |
| Chileans | 97.5 /100 | #103 | Exceptional 41.2% |
| Jordanians | 97.4 /100 | #104 | Exceptional 41.2% |
| Syrians | 97.4 /100 | #105 | Exceptional 41.1% |
| Alsatians | 97.0 /100 | #106 | Exceptional 41.0% |
| Northern Europeans | 96.8 /100 | #107 | Exceptional 41.0% |
| Ukrainians | 96.6 /100 | #108 | Exceptional 40.9% |
| Arabs | 96.6 /100 | #109 | Exceptional 40.9% |
| Albanians | 96.5 /100 | #110 | Exceptional 40.9% |