Tongan vs Immigrants from Lebanon Disability
COMPARE
Tongan
Immigrants from Lebanon
Disability
Disability Comparison
Tongans
Immigrants from Lebanon
10.8%
DISABILITY
99.9/ 100
METRIC RATING
46th/ 347
METRIC RANK
11.0%
DISABILITY
99.4/ 100
METRIC RATING
71st/ 347
METRIC RANK
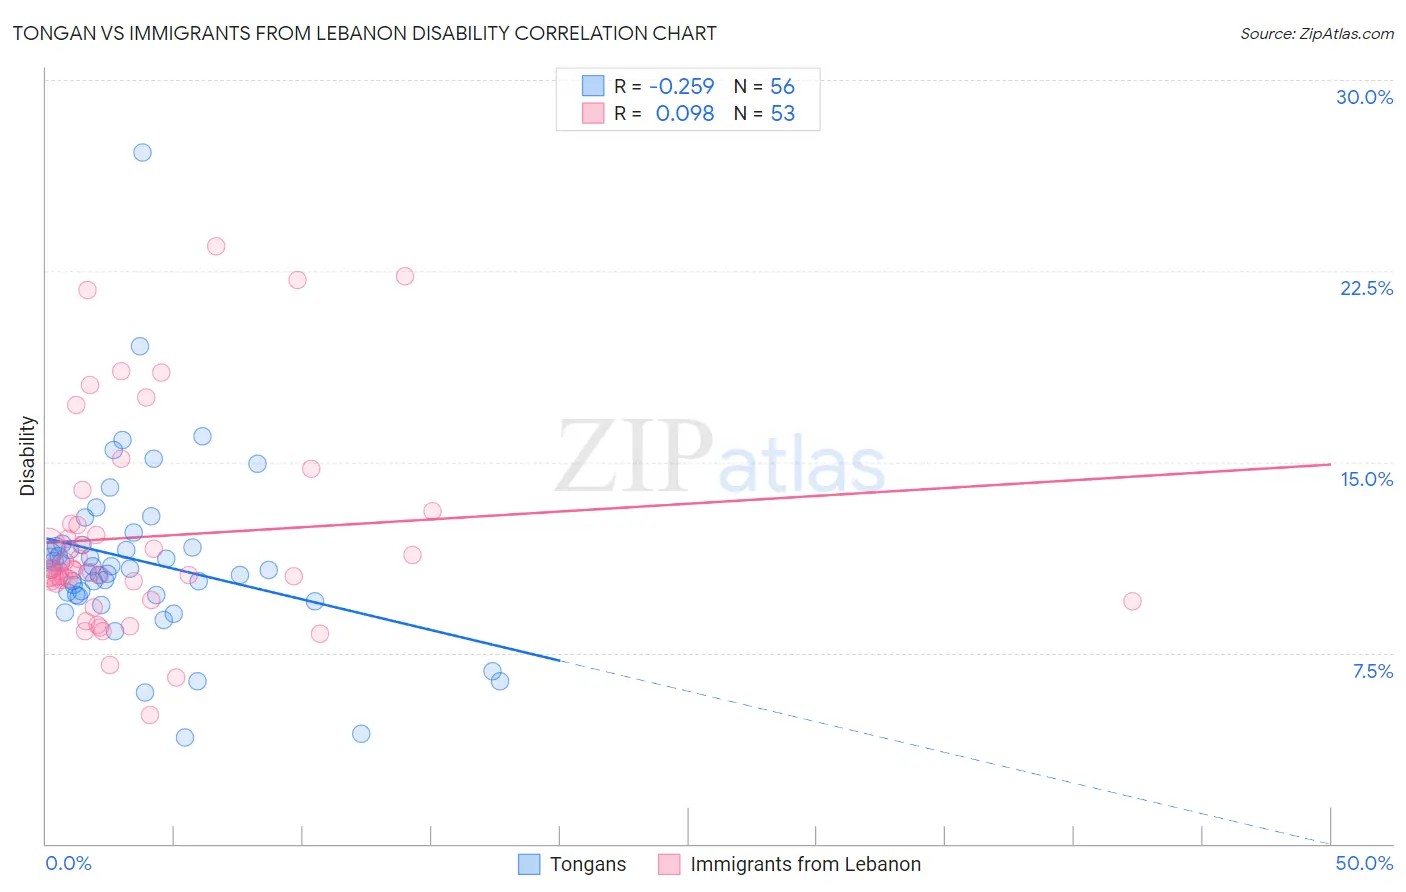
Tongan vs Immigrants from Lebanon Disability Correlation Chart
The statistical analysis conducted on geographies consisting of 102,894,634 people shows a weak negative correlation between the proportion of Tongans and percentage of population with a disability in the United States with a correlation coefficient (R) of -0.259 and weighted average of 10.8%. Similarly, the statistical analysis conducted on geographies consisting of 217,153,550 people shows a slight positive correlation between the proportion of Immigrants from Lebanon and percentage of population with a disability in the United States with a correlation coefficient (R) of 0.098 and weighted average of 11.0%, a difference of 1.8%.
Disability Correlation Summary
| Measurement | Tongan | Immigrants from Lebanon |
| Minimum | 4.2% | 5.1% |
| Maximum | 27.1% | 23.5% |
| Range | 23.0% | 18.4% |
| Mean | 11.1% | 12.1% |
| Median | 10.8% | 10.7% |
| Interquartile 25% (IQ1) | 9.8% | 9.9% |
| Interquartile 75% (IQ3) | 11.7% | 12.8% |
| Interquartile Range (IQR) | 1.9% | 2.9% |
| Standard Deviation (Sample) | 3.5% | 4.1% |
| Standard Deviation (Population) | 3.5% | 4.1% |
Similar Demographics by Disability
Demographics Similar to Tongans by Disability
In terms of disability, the demographic groups most similar to Tongans are Immigrants from Peru (10.8%, a difference of 0.010%), Taiwanese (10.8%, a difference of 0.010%), Soviet Union (10.9%, a difference of 0.20%), Vietnamese (10.9%, a difference of 0.26%), and Immigrants from Saudi Arabia (10.9%, a difference of 0.26%).
| Demographics | Rating | Rank | Disability |
| Cambodians | 99.9 /100 | #39 | Exceptional 10.8% |
| Mongolians | 99.9 /100 | #40 | Exceptional 10.8% |
| Immigrants | Australia | 99.9 /100 | #41 | Exceptional 10.8% |
| Immigrants | Nepal | 99.9 /100 | #42 | Exceptional 10.8% |
| Israelis | 99.9 /100 | #43 | Exceptional 10.8% |
| Immigrants | Japan | 99.9 /100 | #44 | Exceptional 10.8% |
| Immigrants | Peru | 99.9 /100 | #45 | Exceptional 10.8% |
| Tongans | 99.9 /100 | #46 | Exceptional 10.8% |
| Taiwanese | 99.9 /100 | #47 | Exceptional 10.8% |
| Soviet Union | 99.9 /100 | #48 | Exceptional 10.9% |
| Vietnamese | 99.9 /100 | #49 | Exceptional 10.9% |
| Immigrants | Saudi Arabia | 99.9 /100 | #50 | Exceptional 10.9% |
| Peruvians | 99.8 /100 | #51 | Exceptional 10.9% |
| South Americans | 99.8 /100 | #52 | Exceptional 10.9% |
| Immigrants | Spain | 99.8 /100 | #53 | Exceptional 10.9% |
Demographics Similar to Immigrants from Lebanon by Disability
In terms of disability, the demographic groups most similar to Immigrants from Lebanon are Immigrants from France (11.0%, a difference of 0.020%), Sri Lankan (11.0%, a difference of 0.090%), Immigrants from Chile (11.0%, a difference of 0.090%), Immigrants from Bangladesh (11.0%, a difference of 0.11%), and Immigrants from Serbia (11.0%, a difference of 0.13%).
| Demographics | Rating | Rank | Disability |
| Immigrants | Sweden | 99.6 /100 | #64 | Exceptional 11.0% |
| Bulgarians | 99.6 /100 | #65 | Exceptional 11.0% |
| Laotians | 99.6 /100 | #66 | Exceptional 11.0% |
| Colombians | 99.6 /100 | #67 | Exceptional 11.0% |
| Immigrants | Afghanistan | 99.6 /100 | #68 | Exceptional 11.0% |
| Sri Lankans | 99.5 /100 | #69 | Exceptional 11.0% |
| Immigrants | France | 99.4 /100 | #70 | Exceptional 11.0% |
| Immigrants | Lebanon | 99.4 /100 | #71 | Exceptional 11.0% |
| Immigrants | Chile | 99.4 /100 | #72 | Exceptional 11.0% |
| Immigrants | Bangladesh | 99.4 /100 | #73 | Exceptional 11.0% |
| Immigrants | Serbia | 99.4 /100 | #74 | Exceptional 11.0% |
| Immigrants | Vietnam | 99.4 /100 | #75 | Exceptional 11.0% |
| Sierra Leoneans | 99.3 /100 | #76 | Exceptional 11.0% |
| Immigrants | Belgium | 99.3 /100 | #77 | Exceptional 11.0% |
| Immigrants | Cameroon | 99.3 /100 | #78 | Exceptional 11.1% |