Yuman vs Subsaharan African Disability Age Over 75
COMPARE
Yuman
Subsaharan African
Disability Age Over 75
Disability Age Over 75 Comparison
Yuman
Sub-Saharan Africans
54.4%
DISABILITY AGE OVER 75
0.0/ 100
METRIC RATING
337th/ 347
METRIC RANK
48.2%
DISABILITY AGE OVER 75
3.8/ 100
METRIC RATING
234th/ 347
METRIC RANK
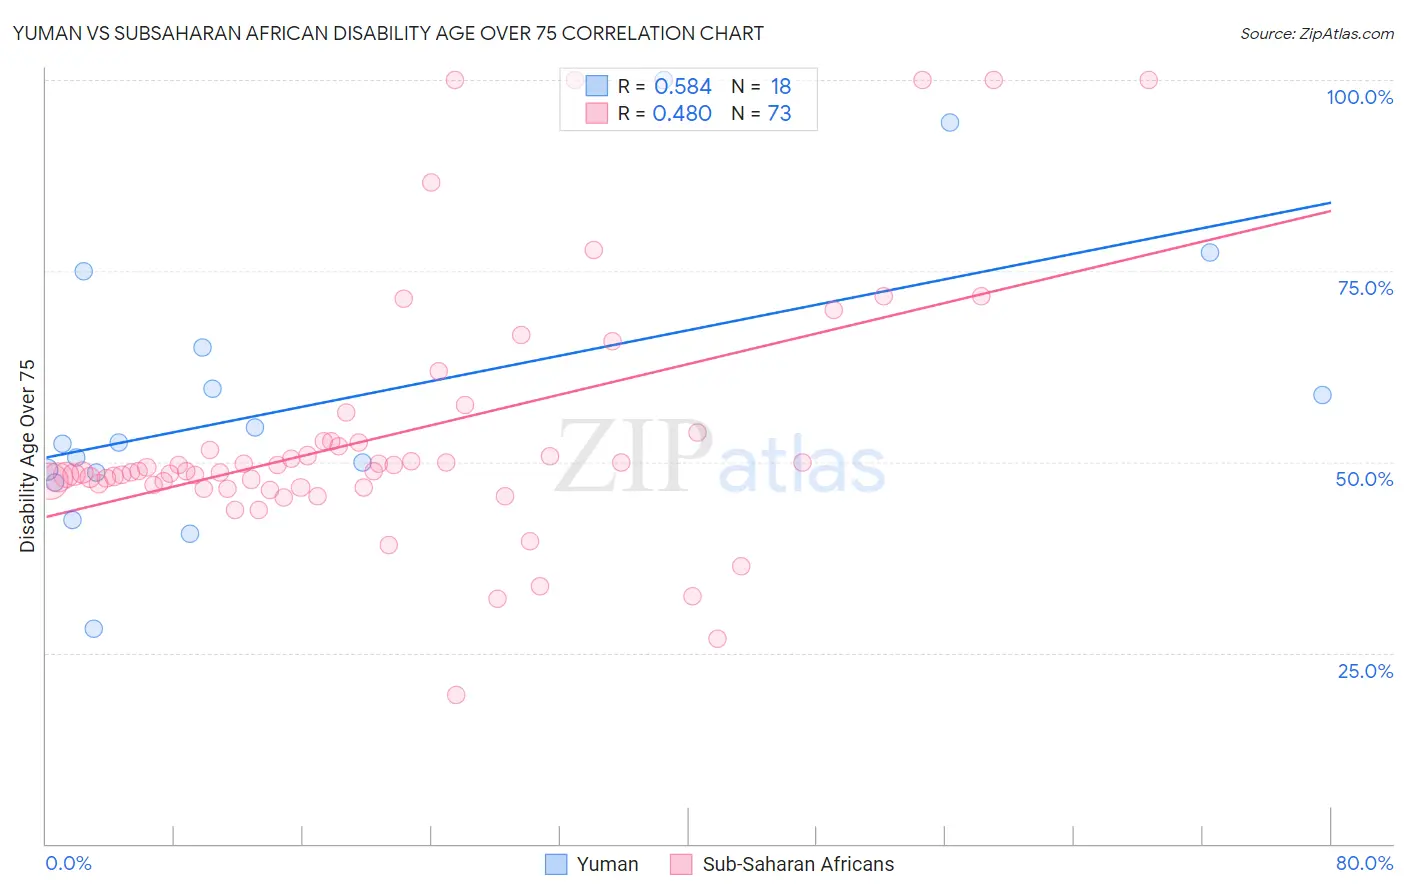
Yuman vs Subsaharan African Disability Age Over 75 Correlation Chart
The statistical analysis conducted on geographies consisting of 40,592,245 people shows a substantial positive correlation between the proportion of Yuman and percentage of population with a disability over the age of 75 in the United States with a correlation coefficient (R) of 0.584 and weighted average of 54.4%. Similarly, the statistical analysis conducted on geographies consisting of 506,598,024 people shows a moderate positive correlation between the proportion of Sub-Saharan Africans and percentage of population with a disability over the age of 75 in the United States with a correlation coefficient (R) of 0.480 and weighted average of 48.2%, a difference of 12.9%.
Disability Age Over 75 Correlation Summary
| Measurement | Yuman | Subsaharan African |
| Minimum | 28.2% | 19.4% |
| Maximum | 100.0% | 100.0% |
| Range | 71.8% | 80.6% |
| Mean | 58.1% | 53.4% |
| Median | 52.4% | 48.8% |
| Interquartile 25% (IQ1) | 48.7% | 46.9% |
| Interquartile 75% (IQ3) | 64.9% | 52.7% |
| Interquartile Range (IQR) | 16.3% | 5.8% |
| Standard Deviation (Sample) | 18.3% | 16.4% |
| Standard Deviation (Population) | 17.8% | 16.3% |
Similar Demographics by Disability Age Over 75
Demographics Similar to Yuman by Disability Age Over 75
In terms of disability age over 75, the demographic groups most similar to Yuman are Immigrants from Armenia (54.3%, a difference of 0.16%), Kiowa (54.2%, a difference of 0.33%), Alaskan Athabascan (54.0%, a difference of 0.85%), Apache (53.6%, a difference of 1.5%), and Colville (55.4%, a difference of 1.8%).
| Demographics | Rating | Rank | Disability Age Over 75 |
| Puerto Ricans | 0.0 /100 | #330 | Tragic 52.9% |
| Hopi | 0.0 /100 | #331 | Tragic 52.9% |
| Natives/Alaskans | 0.0 /100 | #332 | Tragic 53.1% |
| Apache | 0.0 /100 | #333 | Tragic 53.6% |
| Alaskan Athabascans | 0.0 /100 | #334 | Tragic 54.0% |
| Kiowa | 0.0 /100 | #335 | Tragic 54.2% |
| Immigrants | Armenia | 0.0 /100 | #336 | Tragic 54.3% |
| Yuman | 0.0 /100 | #337 | Tragic 54.4% |
| Colville | 0.0 /100 | #338 | Tragic 55.4% |
| Pima | 0.0 /100 | #339 | Tragic 55.8% |
| Pueblo | 0.0 /100 | #340 | Tragic 55.9% |
| Houma | 0.0 /100 | #341 | Tragic 56.2% |
| Lumbee | 0.0 /100 | #342 | Tragic 56.2% |
| Tohono O'odham | 0.0 /100 | #343 | Tragic 56.7% |
| Navajo | 0.0 /100 | #344 | Tragic 58.3% |
Demographics Similar to Sub-Saharan Africans by Disability Age Over 75
In terms of disability age over 75, the demographic groups most similar to Sub-Saharan Africans are Hmong (48.2%, a difference of 0.0%), Indonesian (48.2%, a difference of 0.060%), Cree (48.2%, a difference of 0.060%), Immigrants (48.2%, a difference of 0.080%), and Taiwanese (48.2%, a difference of 0.090%).
| Demographics | Rating | Rank | Disability Age Over 75 |
| Zimbabweans | 6.4 /100 | #227 | Tragic 48.1% |
| Immigrants | Liberia | 5.9 /100 | #228 | Tragic 48.1% |
| Spaniards | 5.7 /100 | #229 | Tragic 48.1% |
| Taiwanese | 4.4 /100 | #230 | Tragic 48.2% |
| Immigrants | Immigrants | 4.3 /100 | #231 | Tragic 48.2% |
| Indonesians | 4.2 /100 | #232 | Tragic 48.2% |
| Cree | 4.2 /100 | #233 | Tragic 48.2% |
| Sub-Saharan Africans | 3.8 /100 | #234 | Tragic 48.2% |
| Hmong | 3.8 /100 | #235 | Tragic 48.2% |
| Immigrants | Nicaragua | 3.2 /100 | #236 | Tragic 48.2% |
| Immigrants | St. Vincent and the Grenadines | 3.2 /100 | #237 | Tragic 48.2% |
| Nicaraguans | 3.0 /100 | #238 | Tragic 48.3% |
| Immigrants | Thailand | 2.8 /100 | #239 | Tragic 48.3% |
| Tongans | 2.3 /100 | #240 | Tragic 48.3% |
| Native Hawaiians | 2.2 /100 | #241 | Tragic 48.3% |