Jamaican vs Subsaharan African Disability Age Over 75
COMPARE
Jamaican
Subsaharan African
Disability Age Over 75
Disability Age Over 75 Comparison
Jamaicans
Sub-Saharan Africans
47.7%
DISABILITY AGE OVER 75
19.0/ 100
METRIC RATING
206th/ 347
METRIC RANK
48.2%
DISABILITY AGE OVER 75
3.8/ 100
METRIC RATING
234th/ 347
METRIC RANK
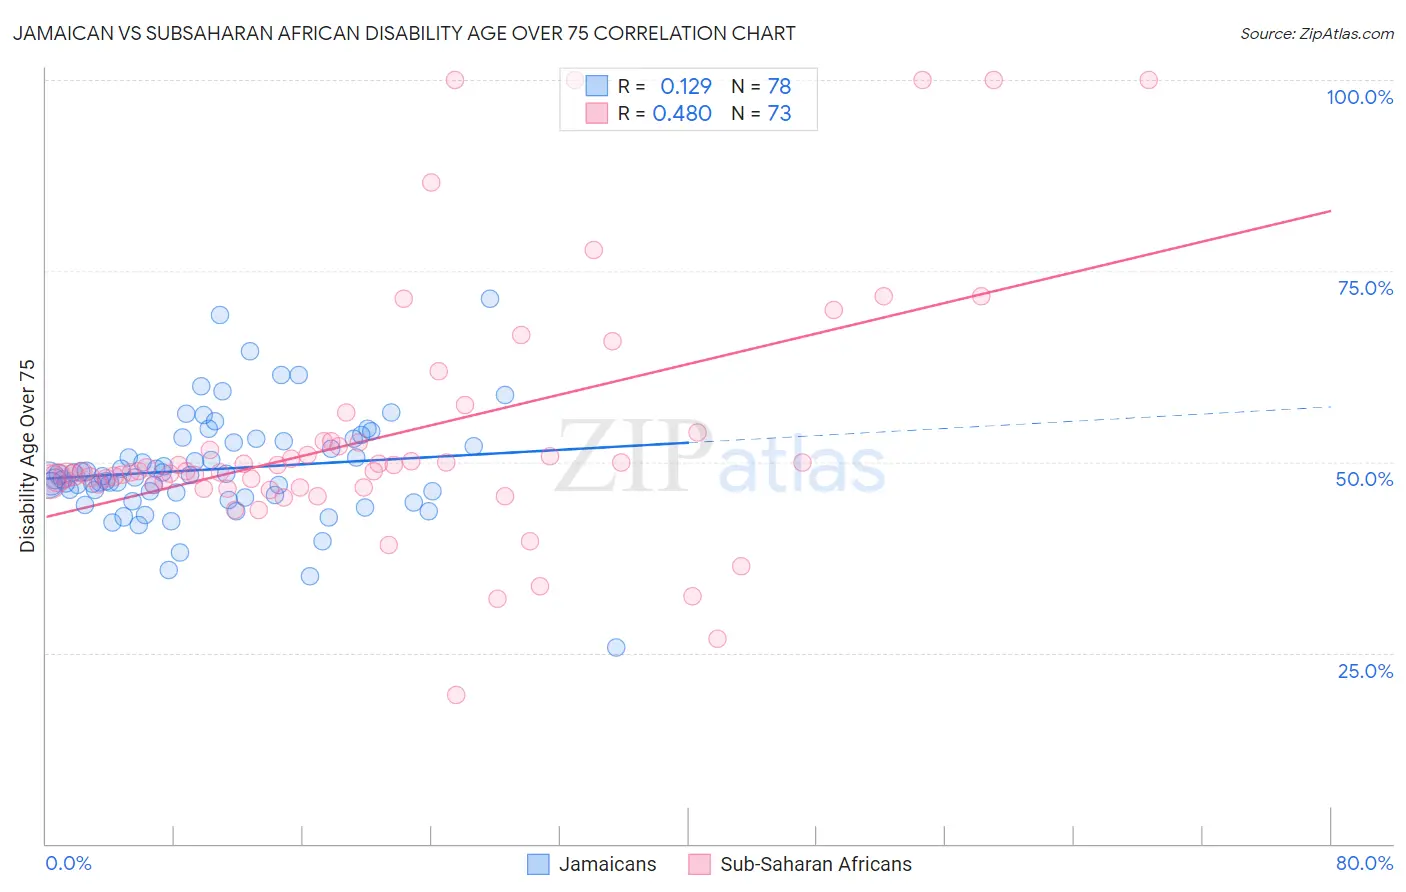
Jamaican vs Subsaharan African Disability Age Over 75 Correlation Chart
The statistical analysis conducted on geographies consisting of 366,963,614 people shows a poor positive correlation between the proportion of Jamaicans and percentage of population with a disability over the age of 75 in the United States with a correlation coefficient (R) of 0.129 and weighted average of 47.7%. Similarly, the statistical analysis conducted on geographies consisting of 506,598,024 people shows a moderate positive correlation between the proportion of Sub-Saharan Africans and percentage of population with a disability over the age of 75 in the United States with a correlation coefficient (R) of 0.480 and weighted average of 48.2%, a difference of 0.99%.
Disability Age Over 75 Correlation Summary
| Measurement | Jamaican | Subsaharan African |
| Minimum | 25.7% | 19.4% |
| Maximum | 71.4% | 100.0% |
| Range | 45.7% | 80.6% |
| Mean | 49.0% | 53.4% |
| Median | 48.1% | 48.8% |
| Interquartile 25% (IQ1) | 45.7% | 46.9% |
| Interquartile 75% (IQ3) | 52.8% | 52.7% |
| Interquartile Range (IQR) | 7.1% | 5.8% |
| Standard Deviation (Sample) | 7.0% | 16.4% |
| Standard Deviation (Population) | 7.0% | 16.3% |
Similar Demographics by Disability Age Over 75
Demographics Similar to Jamaicans by Disability Age Over 75
In terms of disability age over 75, the demographic groups most similar to Jamaicans are Immigrants from Ghana (47.7%, a difference of 0.0%), Nigerian (47.7%, a difference of 0.010%), Trinidadian and Tobagonian (47.7%, a difference of 0.040%), Immigrants from Cuba (47.7%, a difference of 0.060%), and Immigrants from Bahamas (47.7%, a difference of 0.060%).
| Demographics | Rating | Rank | Disability Age Over 75 |
| Immigrants | Eritrea | 22.4 /100 | #199 | Fair 47.7% |
| Immigrants | Somalia | 21.4 /100 | #200 | Fair 47.7% |
| Immigrants | Cuba | 20.9 /100 | #201 | Fair 47.7% |
| Immigrants | Bahamas | 20.7 /100 | #202 | Fair 47.7% |
| Trinidadians and Tobagonians | 20.0 /100 | #203 | Fair 47.7% |
| Nigerians | 19.2 /100 | #204 | Poor 47.7% |
| Immigrants | Ghana | 19.1 /100 | #205 | Poor 47.7% |
| Jamaicans | 19.0 /100 | #206 | Poor 47.7% |
| Immigrants | Syria | 17.4 /100 | #207 | Poor 47.8% |
| Immigrants | Senegal | 16.9 /100 | #208 | Poor 47.8% |
| Immigrants | Indonesia | 14.2 /100 | #209 | Poor 47.8% |
| Vietnamese | 11.9 /100 | #210 | Poor 47.9% |
| Panamanians | 11.8 /100 | #211 | Poor 47.9% |
| Immigrants | Burma/Myanmar | 11.7 /100 | #212 | Poor 47.9% |
| Laotians | 11.5 /100 | #213 | Poor 47.9% |
Demographics Similar to Sub-Saharan Africans by Disability Age Over 75
In terms of disability age over 75, the demographic groups most similar to Sub-Saharan Africans are Hmong (48.2%, a difference of 0.0%), Indonesian (48.2%, a difference of 0.060%), Cree (48.2%, a difference of 0.060%), Immigrants (48.2%, a difference of 0.080%), and Taiwanese (48.2%, a difference of 0.090%).
| Demographics | Rating | Rank | Disability Age Over 75 |
| Zimbabweans | 6.4 /100 | #227 | Tragic 48.1% |
| Immigrants | Liberia | 5.9 /100 | #228 | Tragic 48.1% |
| Spaniards | 5.7 /100 | #229 | Tragic 48.1% |
| Taiwanese | 4.4 /100 | #230 | Tragic 48.2% |
| Immigrants | Immigrants | 4.3 /100 | #231 | Tragic 48.2% |
| Indonesians | 4.2 /100 | #232 | Tragic 48.2% |
| Cree | 4.2 /100 | #233 | Tragic 48.2% |
| Sub-Saharan Africans | 3.8 /100 | #234 | Tragic 48.2% |
| Hmong | 3.8 /100 | #235 | Tragic 48.2% |
| Immigrants | Nicaragua | 3.2 /100 | #236 | Tragic 48.2% |
| Immigrants | St. Vincent and the Grenadines | 3.2 /100 | #237 | Tragic 48.2% |
| Nicaraguans | 3.0 /100 | #238 | Tragic 48.3% |
| Immigrants | Thailand | 2.8 /100 | #239 | Tragic 48.3% |
| Tongans | 2.3 /100 | #240 | Tragic 48.3% |
| Native Hawaiians | 2.2 /100 | #241 | Tragic 48.3% |