Tlingit-Haida vs Nepalese Disability Age 18 to 34
COMPARE
Tlingit-Haida
Nepalese
Disability Age 18 to 34
Disability Age 18 to 34 Comparison
Tlingit-Haida
Nepalese
7.7%
DISABILITY AGE 18 TO 34
0.0/ 100
METRIC RATING
295th/ 347
METRIC RANK
7.1%
DISABILITY AGE 18 TO 34
1.1/ 100
METRIC RATING
241st/ 347
METRIC RANK
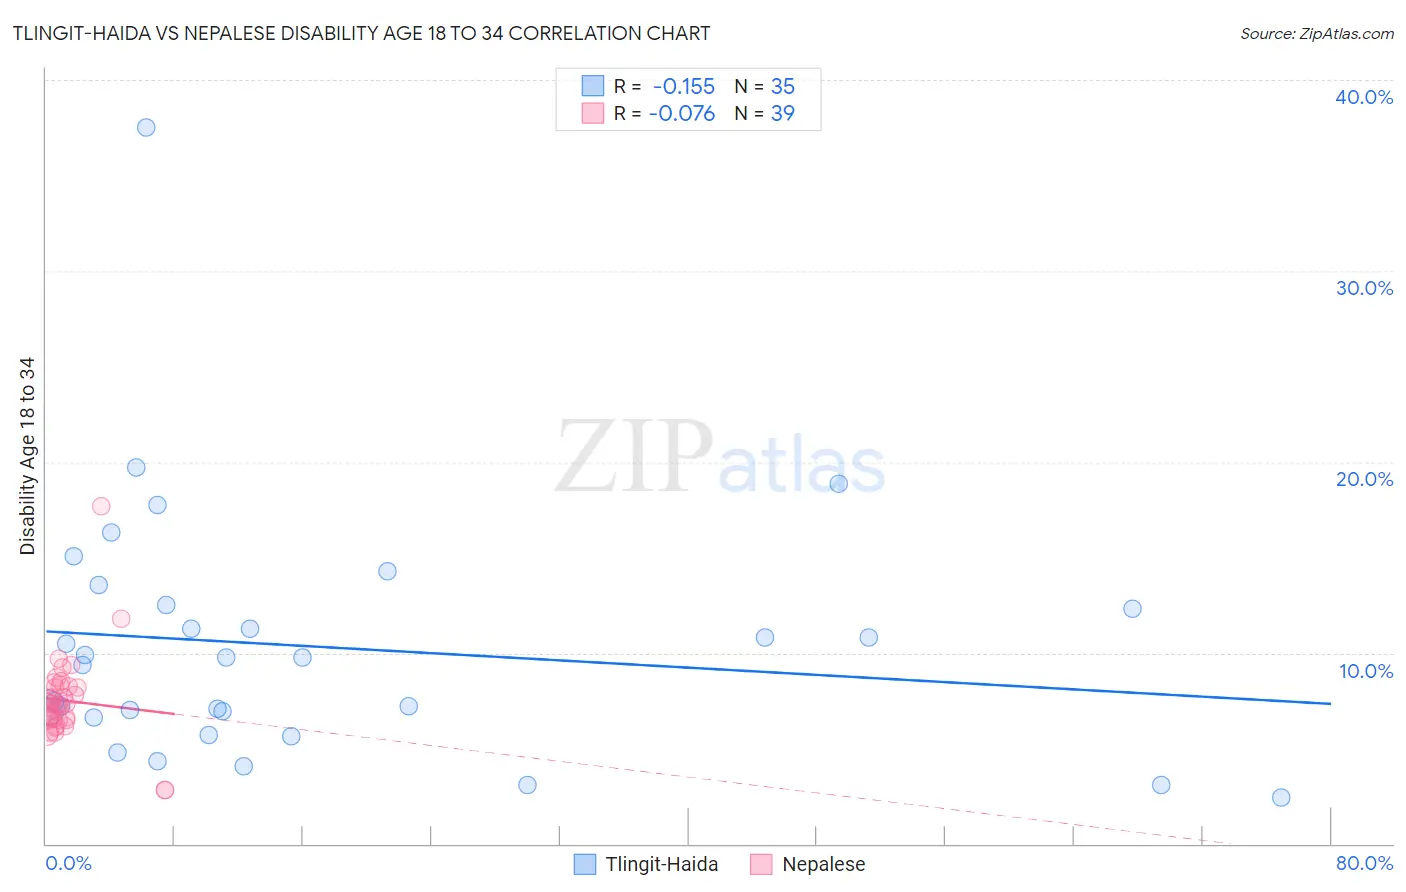
Tlingit-Haida vs Nepalese Disability Age 18 to 34 Correlation Chart
The statistical analysis conducted on geographies consisting of 60,778,142 people shows a poor negative correlation between the proportion of Tlingit-Haida and percentage of population with a disability between the ages 18 and 35 in the United States with a correlation coefficient (R) of -0.155 and weighted average of 7.7%. Similarly, the statistical analysis conducted on geographies consisting of 24,520,458 people shows a slight negative correlation between the proportion of Nepalese and percentage of population with a disability between the ages 18 and 35 in the United States with a correlation coefficient (R) of -0.076 and weighted average of 7.1%, a difference of 8.1%.
Disability Age 18 to 34 Correlation Summary
| Measurement | Tlingit-Haida | Nepalese |
| Minimum | 2.4% | 2.8% |
| Maximum | 37.5% | 17.7% |
| Range | 35.1% | 14.9% |
| Mean | 10.3% | 7.5% |
| Median | 9.7% | 7.3% |
| Interquartile 25% (IQ1) | 6.6% | 6.5% |
| Interquartile 75% (IQ3) | 12.5% | 8.3% |
| Interquartile Range (IQR) | 5.9% | 1.8% |
| Standard Deviation (Sample) | 6.5% | 2.3% |
| Standard Deviation (Population) | 6.4% | 2.3% |
Similar Demographics by Disability Age 18 to 34
Demographics Similar to Tlingit-Haida by Disability Age 18 to 34
In terms of disability age 18 to 34, the demographic groups most similar to Tlingit-Haida are Immigrants from Cabo Verde (7.7%, a difference of 0.010%), Scandinavian (7.7%, a difference of 0.16%), Cape Verdean (7.7%, a difference of 0.18%), Pueblo (7.7%, a difference of 0.19%), and Black/African American (7.7%, a difference of 0.22%).
| Demographics | Rating | Rank | Disability Age 18 to 34 |
| Whites/Caucasians | 0.0 /100 | #288 | Tragic 7.6% |
| Immigrants | Nonimmigrants | 0.0 /100 | #289 | Tragic 7.6% |
| Slovaks | 0.0 /100 | #290 | Tragic 7.7% |
| Irish | 0.0 /100 | #291 | Tragic 7.7% |
| Blacks/African Americans | 0.0 /100 | #292 | Tragic 7.7% |
| Scandinavians | 0.0 /100 | #293 | Tragic 7.7% |
| Immigrants | Cabo Verde | 0.0 /100 | #294 | Tragic 7.7% |
| Tlingit-Haida | 0.0 /100 | #295 | Tragic 7.7% |
| Cape Verdeans | 0.0 /100 | #296 | Tragic 7.7% |
| Pueblo | 0.0 /100 | #297 | Tragic 7.7% |
| Dutch | 0.0 /100 | #298 | Tragic 7.7% |
| Germans | 0.0 /100 | #299 | Tragic 7.7% |
| Scottish | 0.0 /100 | #300 | Tragic 7.7% |
| Pima | 0.0 /100 | #301 | Tragic 7.7% |
| Welsh | 0.0 /100 | #302 | Tragic 7.7% |
Demographics Similar to Nepalese by Disability Age 18 to 34
In terms of disability age 18 to 34, the demographic groups most similar to Nepalese are Arapaho (7.1%, a difference of 0.0%), Immigrants from Congo (7.1%, a difference of 0.040%), Icelander (7.1%, a difference of 0.11%), Italian (7.1%, a difference of 0.12%), and Marshallese (7.1%, a difference of 0.24%).
| Demographics | Rating | Rank | Disability Age 18 to 34 |
| Alsatians | 2.1 /100 | #234 | Tragic 7.0% |
| Sub-Saharan Africans | 1.7 /100 | #235 | Tragic 7.1% |
| Liberians | 1.5 /100 | #236 | Tragic 7.1% |
| Austrians | 1.3 /100 | #237 | Tragic 7.1% |
| Marshallese | 1.3 /100 | #238 | Tragic 7.1% |
| Italians | 1.2 /100 | #239 | Tragic 7.1% |
| Arapaho | 1.1 /100 | #240 | Tragic 7.1% |
| Nepalese | 1.1 /100 | #241 | Tragic 7.1% |
| Immigrants | Congo | 1.1 /100 | #242 | Tragic 7.1% |
| Icelanders | 1.0 /100 | #243 | Tragic 7.1% |
| Immigrants | Zaire | 0.9 /100 | #244 | Tragic 7.1% |
| Hungarians | 0.9 /100 | #245 | Tragic 7.1% |
| Immigrants | Liberia | 0.8 /100 | #246 | Tragic 7.1% |
| Yugoslavians | 0.8 /100 | #247 | Tragic 7.2% |
| Guamanians/Chamorros | 0.8 /100 | #248 | Tragic 7.2% |