Tlingit-Haida vs Blackfeet Disability Age 18 to 34
COMPARE
Tlingit-Haida
Blackfeet
Disability Age 18 to 34
Disability Age 18 to 34 Comparison
Tlingit-Haida
Blackfeet
7.7%
DISABILITY AGE 18 TO 34
0.0/ 100
METRIC RATING
295th/ 347
METRIC RANK
8.1%
DISABILITY AGE 18 TO 34
0.0/ 100
METRIC RATING
321st/ 347
METRIC RANK
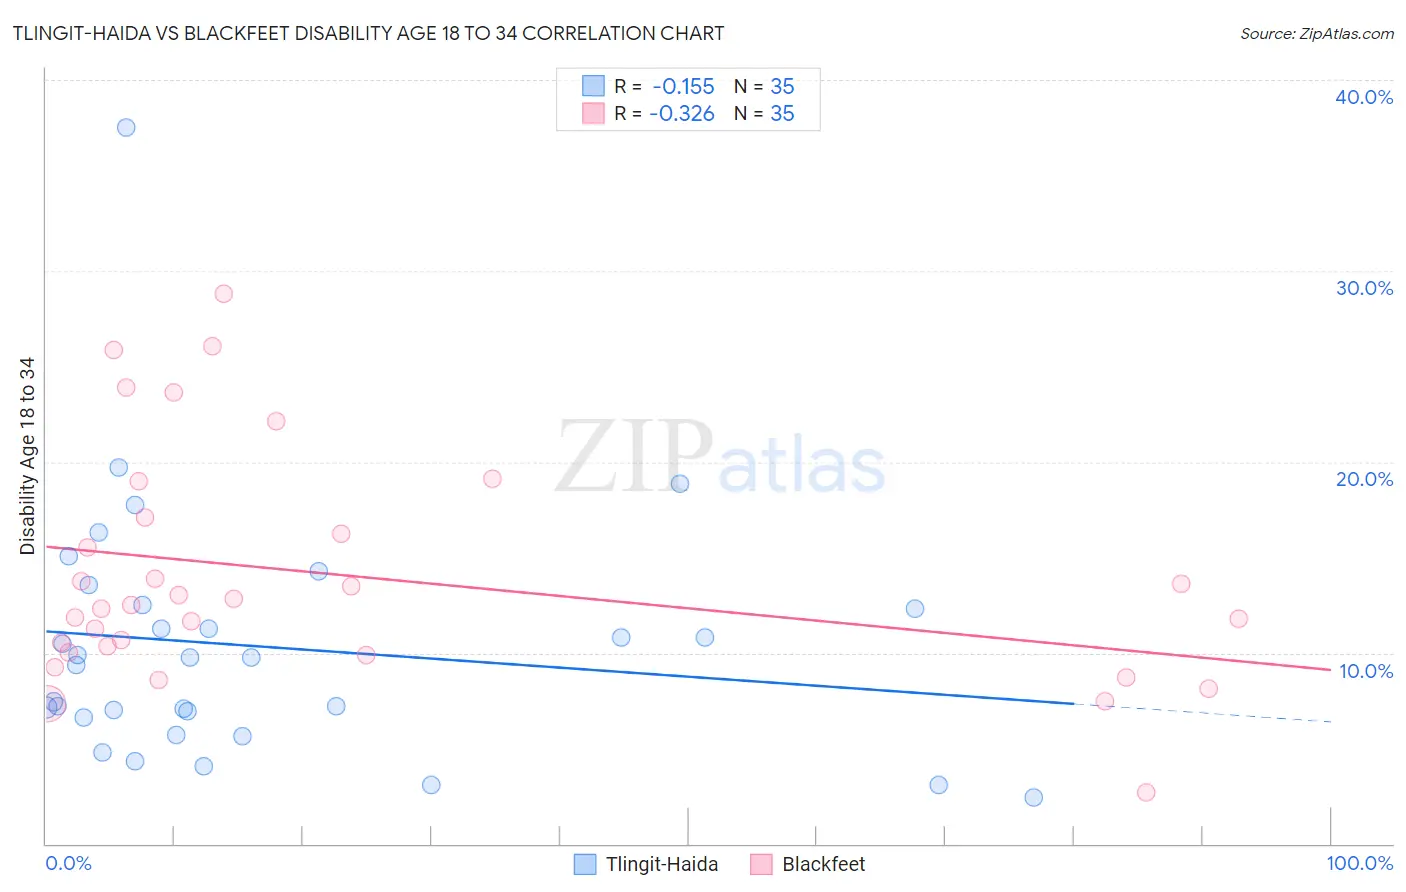
Tlingit-Haida vs Blackfeet Disability Age 18 to 34 Correlation Chart
The statistical analysis conducted on geographies consisting of 60,778,142 people shows a poor negative correlation between the proportion of Tlingit-Haida and percentage of population with a disability between the ages 18 and 35 in the United States with a correlation coefficient (R) of -0.155 and weighted average of 7.7%. Similarly, the statistical analysis conducted on geographies consisting of 309,108,030 people shows a mild negative correlation between the proportion of Blackfeet and percentage of population with a disability between the ages 18 and 35 in the United States with a correlation coefficient (R) of -0.326 and weighted average of 8.1%, a difference of 5.6%.
Disability Age 18 to 34 Correlation Summary
| Measurement | Tlingit-Haida | Blackfeet |
| Minimum | 2.4% | 2.7% |
| Maximum | 37.5% | 28.8% |
| Range | 35.1% | 26.1% |
| Mean | 10.3% | 14.1% |
| Median | 9.7% | 12.5% |
| Interquartile 25% (IQ1) | 6.6% | 10.0% |
| Interquartile 75% (IQ3) | 12.5% | 17.1% |
| Interquartile Range (IQR) | 5.9% | 7.1% |
| Standard Deviation (Sample) | 6.5% | 6.1% |
| Standard Deviation (Population) | 6.4% | 6.0% |
Similar Demographics by Disability Age 18 to 34
Demographics Similar to Tlingit-Haida by Disability Age 18 to 34
In terms of disability age 18 to 34, the demographic groups most similar to Tlingit-Haida are Immigrants from Cabo Verde (7.7%, a difference of 0.010%), Scandinavian (7.7%, a difference of 0.16%), Cape Verdean (7.7%, a difference of 0.18%), Pueblo (7.7%, a difference of 0.19%), and Black/African American (7.7%, a difference of 0.22%).
| Demographics | Rating | Rank | Disability Age 18 to 34 |
| Whites/Caucasians | 0.0 /100 | #288 | Tragic 7.6% |
| Immigrants | Nonimmigrants | 0.0 /100 | #289 | Tragic 7.6% |
| Slovaks | 0.0 /100 | #290 | Tragic 7.7% |
| Irish | 0.0 /100 | #291 | Tragic 7.7% |
| Blacks/African Americans | 0.0 /100 | #292 | Tragic 7.7% |
| Scandinavians | 0.0 /100 | #293 | Tragic 7.7% |
| Immigrants | Cabo Verde | 0.0 /100 | #294 | Tragic 7.7% |
| Tlingit-Haida | 0.0 /100 | #295 | Tragic 7.7% |
| Cape Verdeans | 0.0 /100 | #296 | Tragic 7.7% |
| Pueblo | 0.0 /100 | #297 | Tragic 7.7% |
| Dutch | 0.0 /100 | #298 | Tragic 7.7% |
| Germans | 0.0 /100 | #299 | Tragic 7.7% |
| Scottish | 0.0 /100 | #300 | Tragic 7.7% |
| Pima | 0.0 /100 | #301 | Tragic 7.7% |
| Welsh | 0.0 /100 | #302 | Tragic 7.7% |
Demographics Similar to Blackfeet by Disability Age 18 to 34
In terms of disability age 18 to 34, the demographic groups most similar to Blackfeet are Cree (8.1%, a difference of 0.060%), Navajo (8.1%, a difference of 0.36%), Aleut (8.1%, a difference of 0.41%), French Canadian (8.1%, a difference of 0.45%), and French American Indian (8.2%, a difference of 0.57%).
| Demographics | Rating | Rank | Disability Age 18 to 34 |
| Colville | 0.0 /100 | #314 | Tragic 7.9% |
| Americans | 0.0 /100 | #315 | Tragic 8.0% |
| Puerto Ricans | 0.0 /100 | #316 | Tragic 8.0% |
| Hmong | 0.0 /100 | #317 | Tragic 8.1% |
| French Canadians | 0.0 /100 | #318 | Tragic 8.1% |
| Aleuts | 0.0 /100 | #319 | Tragic 8.1% |
| Navajo | 0.0 /100 | #320 | Tragic 8.1% |
| Blackfeet | 0.0 /100 | #321 | Tragic 8.1% |
| Cree | 0.0 /100 | #322 | Tragic 8.1% |
| French American Indians | 0.0 /100 | #323 | Tragic 8.2% |
| Cajuns | 0.0 /100 | #324 | Tragic 8.2% |
| Natives/Alaskans | 0.0 /100 | #325 | Tragic 8.2% |
| Potawatomi | 0.0 /100 | #326 | Tragic 8.2% |
| Sioux | 0.0 /100 | #327 | Tragic 8.2% |
| Delaware | 0.0 /100 | #328 | Tragic 8.2% |