Tlingit-Haida vs Immigrants from Liberia 3rd Grade
COMPARE
Tlingit-Haida
Immigrants from Liberia
3rd Grade
3rd Grade Comparison
Tlingit-Haida
Immigrants from Liberia
98.5%
3RD GRADE
100.0/ 100
METRIC RATING
13th/ 347
METRIC RANK
97.3%
3RD GRADE
0.5/ 100
METRIC RATING
258th/ 347
METRIC RANK
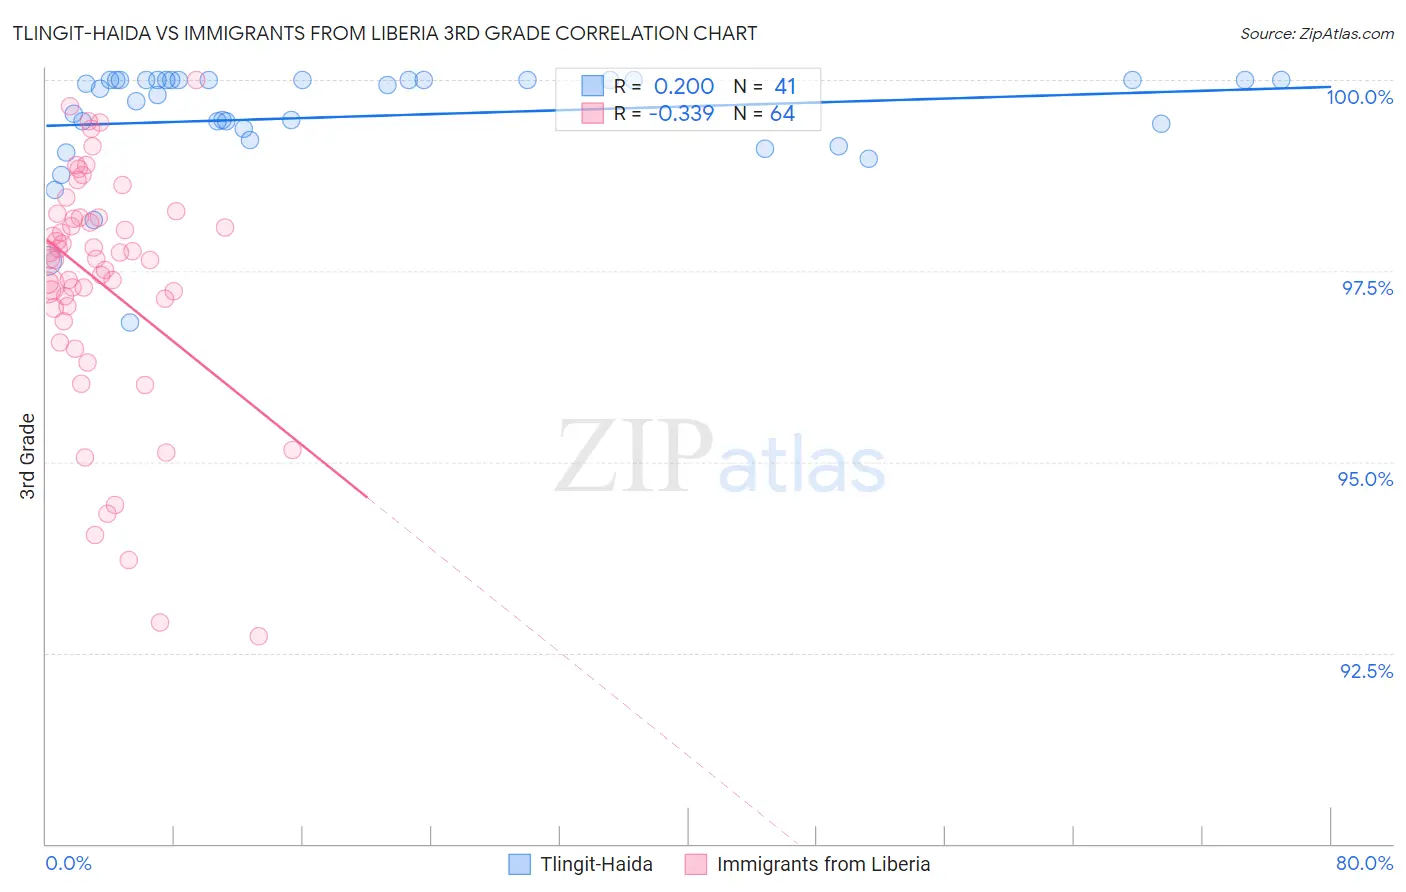
Tlingit-Haida vs Immigrants from Liberia 3rd Grade Correlation Chart
The statistical analysis conducted on geographies consisting of 60,865,648 people shows a poor positive correlation between the proportion of Tlingit-Haida and percentage of population with at least 3rd grade education in the United States with a correlation coefficient (R) of 0.200 and weighted average of 98.5%. Similarly, the statistical analysis conducted on geographies consisting of 135,294,272 people shows a mild negative correlation between the proportion of Immigrants from Liberia and percentage of population with at least 3rd grade education in the United States with a correlation coefficient (R) of -0.339 and weighted average of 97.3%, a difference of 1.3%.
3rd Grade Correlation Summary
| Measurement | Tlingit-Haida | Immigrants from Liberia |
| Minimum | 96.8% | 92.7% |
| Maximum | 100.0% | 100.0% |
| Range | 3.2% | 7.3% |
| Mean | 99.5% | 97.3% |
| Median | 99.9% | 97.7% |
| Interquartile 25% (IQ1) | 99.3% | 97.0% |
| Interquartile 75% (IQ3) | 100.0% | 98.2% |
| Interquartile Range (IQR) | 0.71% | 1.2% |
| Standard Deviation (Sample) | 0.71% | 1.6% |
| Standard Deviation (Population) | 0.70% | 1.6% |
Similar Demographics by 3rd Grade
Demographics Similar to Tlingit-Haida by 3rd Grade
In terms of 3rd grade, the demographic groups most similar to Tlingit-Haida are English (98.6%, a difference of 0.0%), Carpatho Rusyn (98.5%, a difference of 0.0%), Swedish (98.5%, a difference of 0.010%), Alaska Native (98.6%, a difference of 0.020%), and Slovene (98.6%, a difference of 0.020%).
| Demographics | Rating | Rank | 3rd Grade |
| Alaskan Athabascans | 100.0 /100 | #6 | Exceptional 98.7% |
| Norwegians | 100.0 /100 | #7 | Exceptional 98.6% |
| Slovaks | 100.0 /100 | #8 | Exceptional 98.6% |
| Germans | 100.0 /100 | #9 | Exceptional 98.6% |
| Alaska Natives | 100.0 /100 | #10 | Exceptional 98.6% |
| Slovenes | 100.0 /100 | #11 | Exceptional 98.6% |
| English | 100.0 /100 | #12 | Exceptional 98.6% |
| Tlingit-Haida | 100.0 /100 | #13 | Exceptional 98.5% |
| Carpatho Rusyns | 100.0 /100 | #14 | Exceptional 98.5% |
| Swedes | 100.0 /100 | #15 | Exceptional 98.5% |
| Scottish | 100.0 /100 | #16 | Exceptional 98.5% |
| Dutch | 100.0 /100 | #17 | Exceptional 98.5% |
| Irish | 100.0 /100 | #18 | Exceptional 98.5% |
| Poles | 100.0 /100 | #19 | Exceptional 98.5% |
| Pennsylvania Germans | 100.0 /100 | #20 | Exceptional 98.5% |
Demographics Similar to Immigrants from Liberia by 3rd Grade
In terms of 3rd grade, the demographic groups most similar to Immigrants from Liberia are Immigrants from Colombia (97.3%, a difference of 0.010%), Armenian (97.3%, a difference of 0.010%), Immigrants from Ethiopia (97.3%, a difference of 0.010%), Bolivian (97.3%, a difference of 0.020%), and Immigrants from Congo (97.3%, a difference of 0.020%).
| Demographics | Rating | Rank | 3rd Grade |
| Immigrants | Asia | 0.8 /100 | #251 | Tragic 97.4% |
| Peruvians | 0.8 /100 | #252 | Tragic 97.4% |
| Immigrants | Africa | 0.8 /100 | #253 | Tragic 97.4% |
| Jamaicans | 0.7 /100 | #254 | Tragic 97.4% |
| Bolivians | 0.6 /100 | #255 | Tragic 97.3% |
| Immigrants | Congo | 0.6 /100 | #256 | Tragic 97.3% |
| Immigrants | Colombia | 0.5 /100 | #257 | Tragic 97.3% |
| Immigrants | Liberia | 0.5 /100 | #258 | Tragic 97.3% |
| Armenians | 0.4 /100 | #259 | Tragic 97.3% |
| Immigrants | Ethiopia | 0.4 /100 | #260 | Tragic 97.3% |
| Immigrants | South America | 0.4 /100 | #261 | Tragic 97.3% |
| Immigrants | Sierra Leone | 0.4 /100 | #262 | Tragic 97.3% |
| Taiwanese | 0.3 /100 | #263 | Tragic 97.3% |
| West Indians | 0.3 /100 | #264 | Tragic 97.3% |
| Immigrants | Jamaica | 0.3 /100 | #265 | Tragic 97.3% |