Tlingit-Haida vs Immigrants from Jordan 9th Grade
COMPARE
Tlingit-Haida
Immigrants from Jordan
9th Grade
9th Grade Comparison
Tlingit-Haida
Immigrants from Jordan
96.6%
9TH GRADE
100.0/ 100
METRIC RATING
9th/ 347
METRIC RANK
95.1%
9TH GRADE
81.2/ 100
METRIC RATING
148th/ 347
METRIC RANK
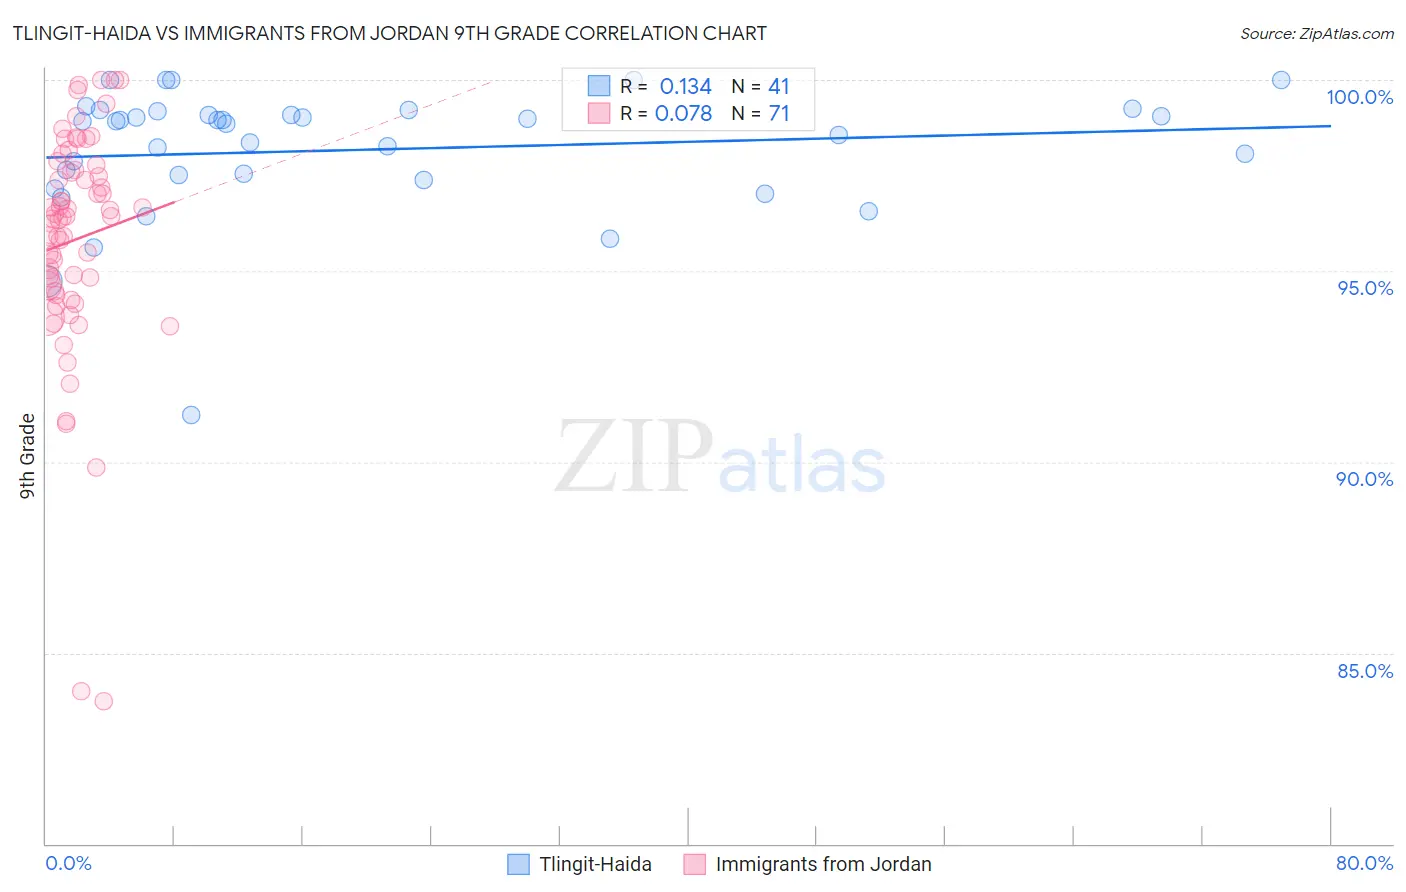
Tlingit-Haida vs Immigrants from Jordan 9th Grade Correlation Chart
The statistical analysis conducted on geographies consisting of 60,871,919 people shows a poor positive correlation between the proportion of Tlingit-Haida and percentage of population with at least 9th grade education in the United States with a correlation coefficient (R) of 0.134 and weighted average of 96.6%. Similarly, the statistical analysis conducted on geographies consisting of 181,278,272 people shows a slight positive correlation between the proportion of Immigrants from Jordan and percentage of population with at least 9th grade education in the United States with a correlation coefficient (R) of 0.078 and weighted average of 95.1%, a difference of 1.6%.
9th Grade Correlation Summary
| Measurement | Tlingit-Haida | Immigrants from Jordan |
| Minimum | 91.2% | 83.7% |
| Maximum | 100.0% | 100.0% |
| Range | 8.8% | 16.3% |
| Mean | 98.2% | 95.8% |
| Median | 98.9% | 96.4% |
| Interquartile 25% (IQ1) | 97.4% | 94.5% |
| Interquartile 75% (IQ3) | 99.1% | 97.6% |
| Interquartile Range (IQR) | 1.7% | 3.2% |
| Standard Deviation (Sample) | 1.7% | 3.0% |
| Standard Deviation (Population) | 1.7% | 3.0% |
Similar Demographics by 9th Grade
Demographics Similar to Tlingit-Haida by 9th Grade
In terms of 9th grade, the demographic groups most similar to Tlingit-Haida are Lithuanian (96.6%, a difference of 0.040%), Finnish (96.6%, a difference of 0.040%), English (96.6%, a difference of 0.060%), German (96.7%, a difference of 0.080%), and Carpatho Rusyn (96.7%, a difference of 0.090%).
| Demographics | Rating | Rank | 9th Grade |
| Norwegians | 100.0 /100 | #2 | Exceptional 96.9% |
| Slovaks | 100.0 /100 | #3 | Exceptional 96.9% |
| Slovenes | 100.0 /100 | #4 | Exceptional 96.7% |
| Swedes | 100.0 /100 | #5 | Exceptional 96.7% |
| Poles | 100.0 /100 | #6 | Exceptional 96.7% |
| Carpatho Rusyns | 100.0 /100 | #7 | Exceptional 96.7% |
| Germans | 100.0 /100 | #8 | Exceptional 96.7% |
| Tlingit-Haida | 100.0 /100 | #9 | Exceptional 96.6% |
| Lithuanians | 100.0 /100 | #10 | Exceptional 96.6% |
| Finns | 100.0 /100 | #11 | Exceptional 96.6% |
| English | 100.0 /100 | #12 | Exceptional 96.6% |
| Danes | 100.0 /100 | #13 | Exceptional 96.5% |
| Scottish | 100.0 /100 | #14 | Exceptional 96.5% |
| Irish | 100.0 /100 | #15 | Exceptional 96.5% |
| Croatians | 100.0 /100 | #16 | Exceptional 96.5% |
Demographics Similar to Immigrants from Jordan by 9th Grade
In terms of 9th grade, the demographic groups most similar to Immigrants from Jordan are Pueblo (95.1%, a difference of 0.010%), Immigrants from Sri Lanka (95.1%, a difference of 0.010%), Choctaw (95.1%, a difference of 0.010%), Immigrants from Korea (95.1%, a difference of 0.020%), and Kenyan (95.1%, a difference of 0.020%).
| Demographics | Rating | Rank | 9th Grade |
| Immigrants | Bosnia and Herzegovina | 85.2 /100 | #141 | Excellent 95.2% |
| Immigrants | Greece | 84.6 /100 | #142 | Excellent 95.2% |
| Spanish | 84.4 /100 | #143 | Excellent 95.2% |
| Yup'ik | 83.3 /100 | #144 | Excellent 95.2% |
| Pueblo | 82.2 /100 | #145 | Excellent 95.1% |
| Immigrants | Sri Lanka | 82.1 /100 | #146 | Excellent 95.1% |
| Choctaw | 81.9 /100 | #147 | Excellent 95.1% |
| Immigrants | Jordan | 81.2 /100 | #148 | Excellent 95.1% |
| Immigrants | Korea | 79.6 /100 | #149 | Good 95.1% |
| Kenyans | 79.1 /100 | #150 | Good 95.1% |
| Cajuns | 77.3 /100 | #151 | Good 95.1% |
| Ugandans | 77.0 /100 | #152 | Good 95.1% |
| Albanians | 76.1 /100 | #153 | Good 95.1% |
| Arabs | 74.9 /100 | #154 | Good 95.1% |
| Immigrants | Kazakhstan | 74.7 /100 | #155 | Good 95.1% |