Thai vs Immigrants from Brazil Family Households with Children
COMPARE
Thai
Immigrants from Brazil
Family Households with Children
Family Households with Children Comparison
Thais
Immigrants from Brazil
30.6%
FAMILY HOUSEHOLDS WITH CHILDREN
100.0/ 100
METRIC RATING
9th/ 347
METRIC RANK
27.4%
FAMILY HOUSEHOLDS WITH CHILDREN
40.6/ 100
METRIC RATING
186th/ 347
METRIC RANK
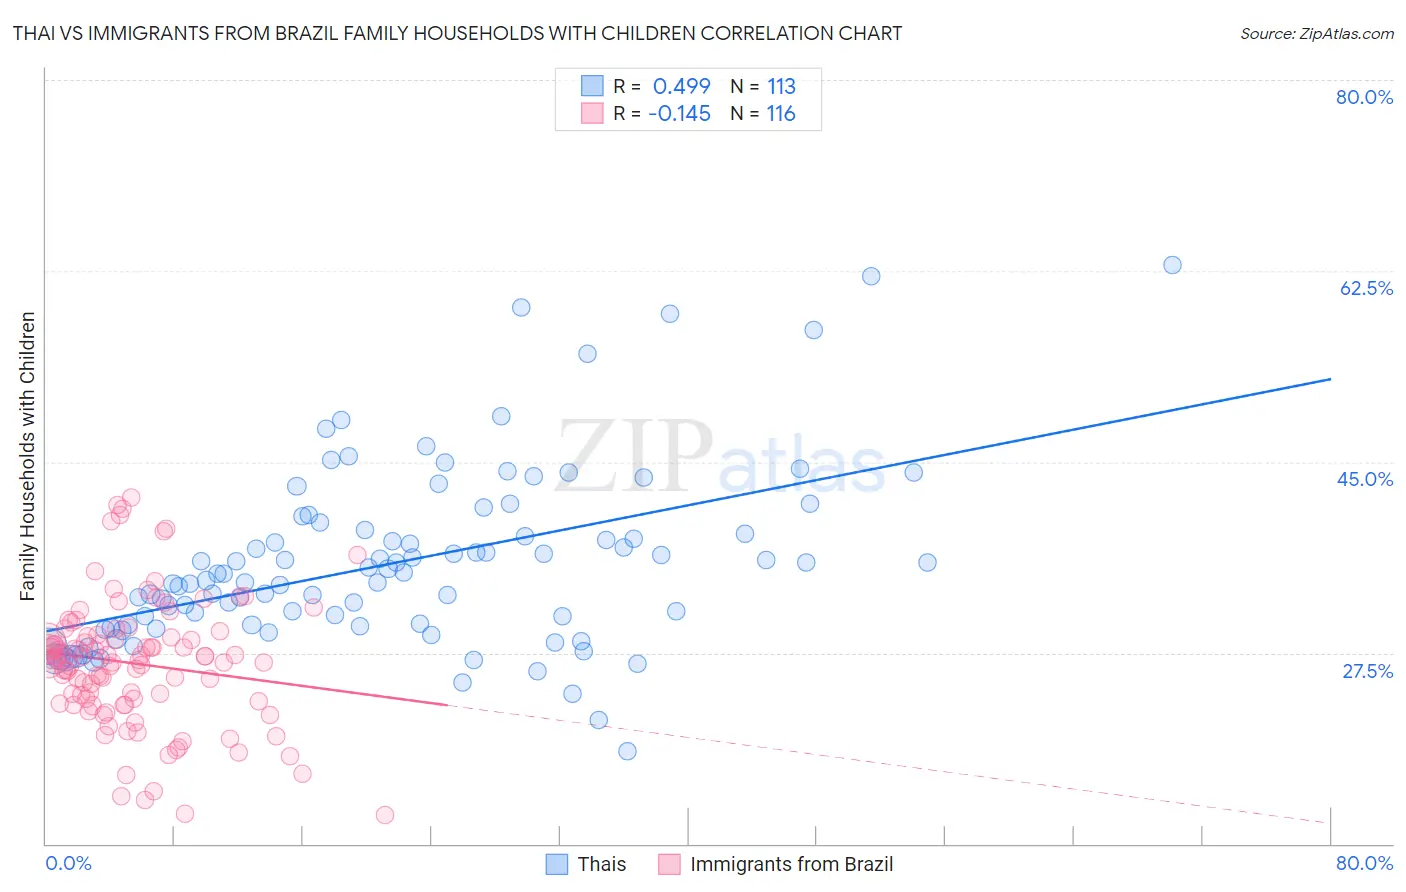
Thai vs Immigrants from Brazil Family Households with Children Correlation Chart
The statistical analysis conducted on geographies consisting of 475,181,925 people shows a moderate positive correlation between the proportion of Thais and percentage of family households with children in the United States with a correlation coefficient (R) of 0.499 and weighted average of 30.6%. Similarly, the statistical analysis conducted on geographies consisting of 342,742,335 people shows a poor negative correlation between the proportion of Immigrants from Brazil and percentage of family households with children in the United States with a correlation coefficient (R) of -0.145 and weighted average of 27.4%, a difference of 11.8%.
Family Households with Children Correlation Summary
| Measurement | Thai | Immigrants from Brazil |
| Minimum | 18.5% | 12.7% |
| Maximum | 63.0% | 41.7% |
| Range | 44.5% | 29.1% |
| Mean | 35.6% | 26.5% |
| Median | 34.1% | 26.9% |
| Interquartile 25% (IQ1) | 29.8% | 22.9% |
| Interquartile 75% (IQ3) | 38.6% | 29.1% |
| Interquartile Range (IQR) | 8.8% | 6.2% |
| Standard Deviation (Sample) | 8.2% | 5.9% |
| Standard Deviation (Population) | 8.2% | 5.9% |
Similar Demographics by Family Households with Children
Demographics Similar to Thais by Family Households with Children
In terms of family households with children, the demographic groups most similar to Thais are Immigrants from Fiji (30.5%, a difference of 0.32%), Nepalese (30.5%, a difference of 0.40%), Yakama (30.8%, a difference of 0.48%), Immigrants from Central America (31.0%, a difference of 1.1%), and Immigrants from Pakistan (30.2%, a difference of 1.3%).
| Demographics | Rating | Rank | Family Households with Children |
| Inupiat | 100 /100 | #2 | Exceptional 32.8% |
| Immigrants | Mexico | 100.0 /100 | #3 | Exceptional 31.6% |
| Mexicans | 100.0 /100 | #4 | Exceptional 31.4% |
| Tongans | 100.0 /100 | #5 | Exceptional 31.2% |
| Immigrants | India | 100.0 /100 | #6 | Exceptional 31.0% |
| Immigrants | Central America | 100.0 /100 | #7 | Exceptional 31.0% |
| Yakama | 100.0 /100 | #8 | Exceptional 30.8% |
| Thais | 100.0 /100 | #9 | Exceptional 30.6% |
| Immigrants | Fiji | 100.0 /100 | #10 | Exceptional 30.5% |
| Nepalese | 100.0 /100 | #11 | Exceptional 30.5% |
| Immigrants | Pakistan | 100.0 /100 | #12 | Exceptional 30.2% |
| Afghans | 100.0 /100 | #13 | Exceptional 30.2% |
| Bangladeshis | 100.0 /100 | #14 | Exceptional 30.1% |
| Immigrants | South Central Asia | 100.0 /100 | #15 | Exceptional 30.0% |
| Immigrants | Afghanistan | 100.0 /100 | #16 | Exceptional 30.0% |
Demographics Similar to Immigrants from Brazil by Family Households with Children
In terms of family households with children, the demographic groups most similar to Immigrants from Brazil are Creek (27.4%, a difference of 0.020%), Delaware (27.4%, a difference of 0.030%), Dutch (27.4%, a difference of 0.040%), Immigrants from Israel (27.4%, a difference of 0.060%), and Immigrants from Uruguay (27.4%, a difference of 0.070%).
| Demographics | Rating | Rank | Family Households with Children |
| Turks | 46.9 /100 | #179 | Average 27.4% |
| Immigrants | Turkey | 46.9 /100 | #180 | Average 27.4% |
| Aleuts | 46.7 /100 | #181 | Average 27.4% |
| Puget Sound Salish | 46.2 /100 | #182 | Average 27.4% |
| South Africans | 44.9 /100 | #183 | Average 27.4% |
| Native Hawaiians | 44.6 /100 | #184 | Average 27.4% |
| Delaware | 42.0 /100 | #185 | Average 27.4% |
| Immigrants | Brazil | 40.6 /100 | #186 | Average 27.4% |
| Creek | 39.8 /100 | #187 | Fair 27.4% |
| Dutch | 38.8 /100 | #188 | Fair 27.4% |
| Immigrants | Israel | 37.9 /100 | #189 | Fair 27.4% |
| Immigrants | Uruguay | 37.7 /100 | #190 | Fair 27.4% |
| Sudanese | 37.6 /100 | #191 | Fair 27.4% |
| Pennsylvania Germans | 37.5 /100 | #192 | Fair 27.4% |
| Swedes | 36.9 /100 | #193 | Fair 27.4% |