Thai vs Panamanian Hearing Disability
COMPARE
Thai
Panamanian
Hearing Disability
Hearing Disability Comparison
Thais
Panamanians
2.5%
HEARING DISABILITY
99.8/ 100
METRIC RATING
19th/ 347
METRIC RANK
3.0%
HEARING DISABILITY
47.0/ 100
METRIC RATING
176th/ 347
METRIC RANK
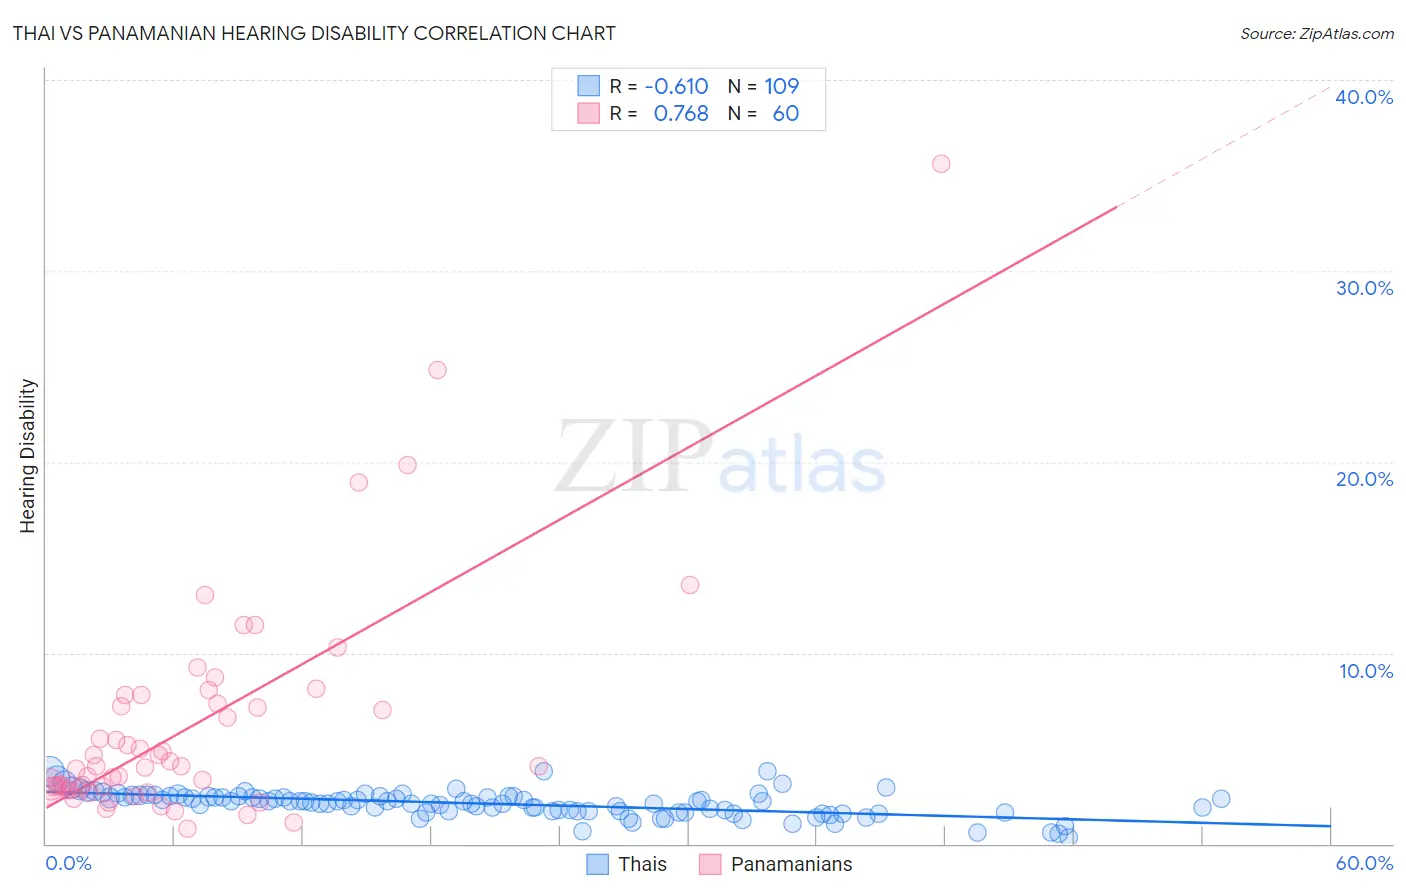
Thai vs Panamanian Hearing Disability Correlation Chart
The statistical analysis conducted on geographies consisting of 475,566,624 people shows a significant negative correlation between the proportion of Thais and percentage of population with hearing disability in the United States with a correlation coefficient (R) of -0.610 and weighted average of 2.5%. Similarly, the statistical analysis conducted on geographies consisting of 281,114,071 people shows a strong positive correlation between the proportion of Panamanians and percentage of population with hearing disability in the United States with a correlation coefficient (R) of 0.768 and weighted average of 3.0%, a difference of 17.9%.
Hearing Disability Correlation Summary
| Measurement | Thai | Panamanian |
| Minimum | 0.30% | 0.76% |
| Maximum | 3.8% | 35.6% |
| Range | 3.5% | 34.9% |
| Mean | 2.1% | 6.2% |
| Median | 2.2% | 4.0% |
| Interquartile 25% (IQ1) | 1.7% | 2.9% |
| Interquartile 75% (IQ3) | 2.5% | 7.6% |
| Interquartile Range (IQR) | 0.79% | 4.7% |
| Standard Deviation (Sample) | 0.65% | 6.1% |
| Standard Deviation (Population) | 0.65% | 6.0% |
Similar Demographics by Hearing Disability
Demographics Similar to Thais by Hearing Disability
In terms of hearing disability, the demographic groups most similar to Thais are Dominican (2.5%, a difference of 0.030%), Immigrants from Bolivia (2.5%, a difference of 0.050%), Ghanaian (2.5%, a difference of 0.11%), Immigrants from Sierra Leone (2.6%, a difference of 0.16%), and Immigrants from Nigeria (2.6%, a difference of 0.65%).
| Demographics | Rating | Rank | Hearing Disability |
| Trinidadians and Tobagonians | 99.9 /100 | #12 | Exceptional 2.5% |
| Sierra Leoneans | 99.9 /100 | #13 | Exceptional 2.5% |
| Ecuadorians | 99.9 /100 | #14 | Exceptional 2.5% |
| Barbadians | 99.9 /100 | #15 | Exceptional 2.5% |
| Immigrants | West Indies | 99.9 /100 | #16 | Exceptional 2.5% |
| Immigrants | India | 99.9 /100 | #17 | Exceptional 2.5% |
| Dominicans | 99.8 /100 | #18 | Exceptional 2.5% |
| Thais | 99.8 /100 | #19 | Exceptional 2.5% |
| Immigrants | Bolivia | 99.8 /100 | #20 | Exceptional 2.5% |
| Ghanaians | 99.8 /100 | #21 | Exceptional 2.5% |
| Immigrants | Sierra Leone | 99.8 /100 | #22 | Exceptional 2.6% |
| Immigrants | Nigeria | 99.8 /100 | #23 | Exceptional 2.6% |
| Immigrants | Ghana | 99.8 /100 | #24 | Exceptional 2.6% |
| Immigrants | El Salvador | 99.7 /100 | #25 | Exceptional 2.6% |
| Immigrants | Senegal | 99.7 /100 | #26 | Exceptional 2.6% |
Demographics Similar to Panamanians by Hearing Disability
In terms of hearing disability, the demographic groups most similar to Panamanians are Immigrants from Philippines (3.0%, a difference of 0.060%), Japanese (3.0%, a difference of 0.10%), Immigrants from Romania (3.0%, a difference of 0.14%), Indonesian (3.0%, a difference of 0.28%), and Immigrants from Moldova (3.0%, a difference of 0.37%).
| Demographics | Rating | Rank | Hearing Disability |
| Arabs | 57.6 /100 | #169 | Average 3.0% |
| Immigrants | Cabo Verde | 56.9 /100 | #170 | Average 3.0% |
| Immigrants | Ukraine | 56.6 /100 | #171 | Average 3.0% |
| Armenians | 56.0 /100 | #172 | Average 3.0% |
| Immigrants | Serbia | 51.1 /100 | #173 | Average 3.0% |
| Indonesians | 50.0 /100 | #174 | Average 3.0% |
| Immigrants | Romania | 48.4 /100 | #175 | Average 3.0% |
| Panamanians | 47.0 /100 | #176 | Average 3.0% |
| Immigrants | Philippines | 46.4 /100 | #177 | Average 3.0% |
| Japanese | 46.0 /100 | #178 | Average 3.0% |
| Immigrants | Moldova | 43.1 /100 | #179 | Average 3.0% |
| Immigrants | Sweden | 42.4 /100 | #180 | Average 3.0% |
| Immigrants | Belgium | 41.5 /100 | #181 | Average 3.0% |
| Immigrants | Italy | 41.1 /100 | #182 | Average 3.0% |
| Bulgarians | 39.7 /100 | #183 | Fair 3.0% |