Thai vs Immigrants from Costa Rica Disability Age 5 to 17
COMPARE
Thai
Immigrants from Costa Rica
Disability Age 5 to 17
Disability Age 5 to 17 Comparison
Thais
Immigrants from Costa Rica
4.7%
DISABILITY AGE 5 TO 17
100.0/ 100
METRIC RATING
13th/ 347
METRIC RANK
5.5%
DISABILITY AGE 5 TO 17
77.9/ 100
METRIC RATING
157th/ 347
METRIC RANK
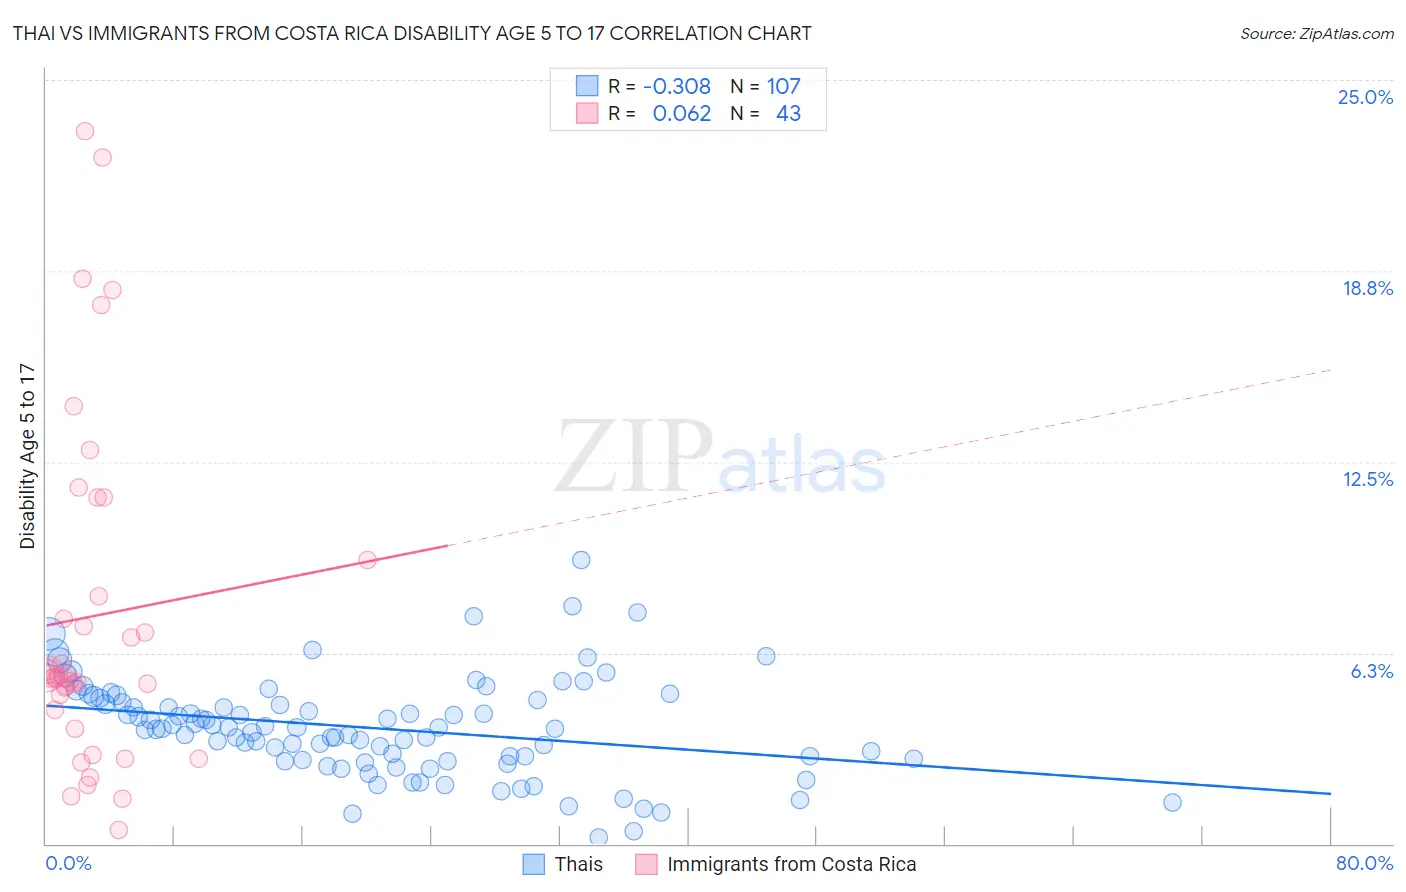
Thai vs Immigrants from Costa Rica Disability Age 5 to 17 Correlation Chart
The statistical analysis conducted on geographies consisting of 470,579,887 people shows a mild negative correlation between the proportion of Thais and percentage of population with a disability between the ages 5 and 17 in the United States with a correlation coefficient (R) of -0.308 and weighted average of 4.7%. Similarly, the statistical analysis conducted on geographies consisting of 203,667,525 people shows a slight positive correlation between the proportion of Immigrants from Costa Rica and percentage of population with a disability between the ages 5 and 17 in the United States with a correlation coefficient (R) of 0.062 and weighted average of 5.5%, a difference of 18.5%.
Disability Age 5 to 17 Correlation Summary
| Measurement | Thai | Immigrants from Costa Rica |
| Minimum | 0.21% | 0.44% |
| Maximum | 9.3% | 23.3% |
| Range | 9.1% | 22.9% |
| Mean | 3.8% | 7.4% |
| Median | 3.8% | 5.5% |
| Interquartile 25% (IQ1) | 2.7% | 4.4% |
| Interquartile 75% (IQ3) | 4.7% | 9.3% |
| Interquartile Range (IQR) | 2.0% | 4.9% |
| Standard Deviation (Sample) | 1.6% | 5.6% |
| Standard Deviation (Population) | 1.6% | 5.5% |
Similar Demographics by Disability Age 5 to 17
Demographics Similar to Thais by Disability Age 5 to 17
In terms of disability age 5 to 17, the demographic groups most similar to Thais are Immigrants from Korea (4.7%, a difference of 0.70%), Chinese (4.7%, a difference of 0.91%), Iranian (4.6%, a difference of 1.1%), Armenian (4.6%, a difference of 1.3%), and Immigrants from Singapore (4.7%, a difference of 1.3%).
| Demographics | Rating | Rank | Disability Age 5 to 17 |
| Immigrants | Israel | 100.0 /100 | #6 | Exceptional 4.5% |
| Immigrants | China | 100.0 /100 | #7 | Exceptional 4.5% |
| Indians (Asian) | 100.0 /100 | #8 | Exceptional 4.6% |
| Immigrants | Eastern Asia | 100.0 /100 | #9 | Exceptional 4.6% |
| Immigrants | India | 100.0 /100 | #10 | Exceptional 4.6% |
| Armenians | 100.0 /100 | #11 | Exceptional 4.6% |
| Iranians | 100.0 /100 | #12 | Exceptional 4.6% |
| Thais | 100.0 /100 | #13 | Exceptional 4.7% |
| Immigrants | Korea | 100.0 /100 | #14 | Exceptional 4.7% |
| Chinese | 100.0 /100 | #15 | Exceptional 4.7% |
| Immigrants | Singapore | 100.0 /100 | #16 | Exceptional 4.7% |
| Arapaho | 100.0 /100 | #17 | Exceptional 4.7% |
| Immigrants | South Central Asia | 100.0 /100 | #18 | Exceptional 4.7% |
| Immigrants | Uzbekistan | 100.0 /100 | #19 | Exceptional 4.8% |
| Burmese | 100.0 /100 | #20 | Exceptional 4.8% |
Demographics Similar to Immigrants from Costa Rica by Disability Age 5 to 17
In terms of disability age 5 to 17, the demographic groups most similar to Immigrants from Costa Rica are Hawaiian (5.5%, a difference of 0.010%), Immigrants from Ecuador (5.5%, a difference of 0.030%), Immigrants from Nepal (5.5%, a difference of 0.050%), Australian (5.5%, a difference of 0.070%), and Ecuadorian (5.5%, a difference of 0.14%).
| Demographics | Rating | Rank | Disability Age 5 to 17 |
| Guatemalans | 81.5 /100 | #150 | Excellent 5.5% |
| Estonians | 80.8 /100 | #151 | Excellent 5.5% |
| Ute | 80.6 /100 | #152 | Excellent 5.5% |
| Ecuadorians | 79.7 /100 | #153 | Good 5.5% |
| Australians | 78.8 /100 | #154 | Good 5.5% |
| Immigrants | Ecuador | 78.3 /100 | #155 | Good 5.5% |
| Hawaiians | 78.0 /100 | #156 | Good 5.5% |
| Immigrants | Costa Rica | 77.9 /100 | #157 | Good 5.5% |
| Immigrants | Nepal | 77.1 /100 | #158 | Good 5.5% |
| Immigrants | Zimbabwe | 75.3 /100 | #159 | Good 5.5% |
| South Africans | 73.3 /100 | #160 | Good 5.5% |
| Immigrants | Saudi Arabia | 69.1 /100 | #161 | Good 5.5% |
| Zimbabweans | 67.2 /100 | #162 | Good 5.5% |
| Immigrants | Southern Europe | 64.0 /100 | #163 | Good 5.6% |
| Immigrants | Scotland | 61.9 /100 | #164 | Good 5.6% |