Thai vs Immigrants from Afghanistan Associate's Degree
COMPARE
Thai
Immigrants from Afghanistan
Associate's Degree
Associate's Degree Comparison
Thais
Immigrants from Afghanistan
57.4%
ASSOCIATE'S DEGREE
100.0/ 100
METRIC RATING
8th/ 347
METRIC RANK
47.3%
ASSOCIATE'S DEGREE
74.3/ 100
METRIC RATING
152nd/ 347
METRIC RANK
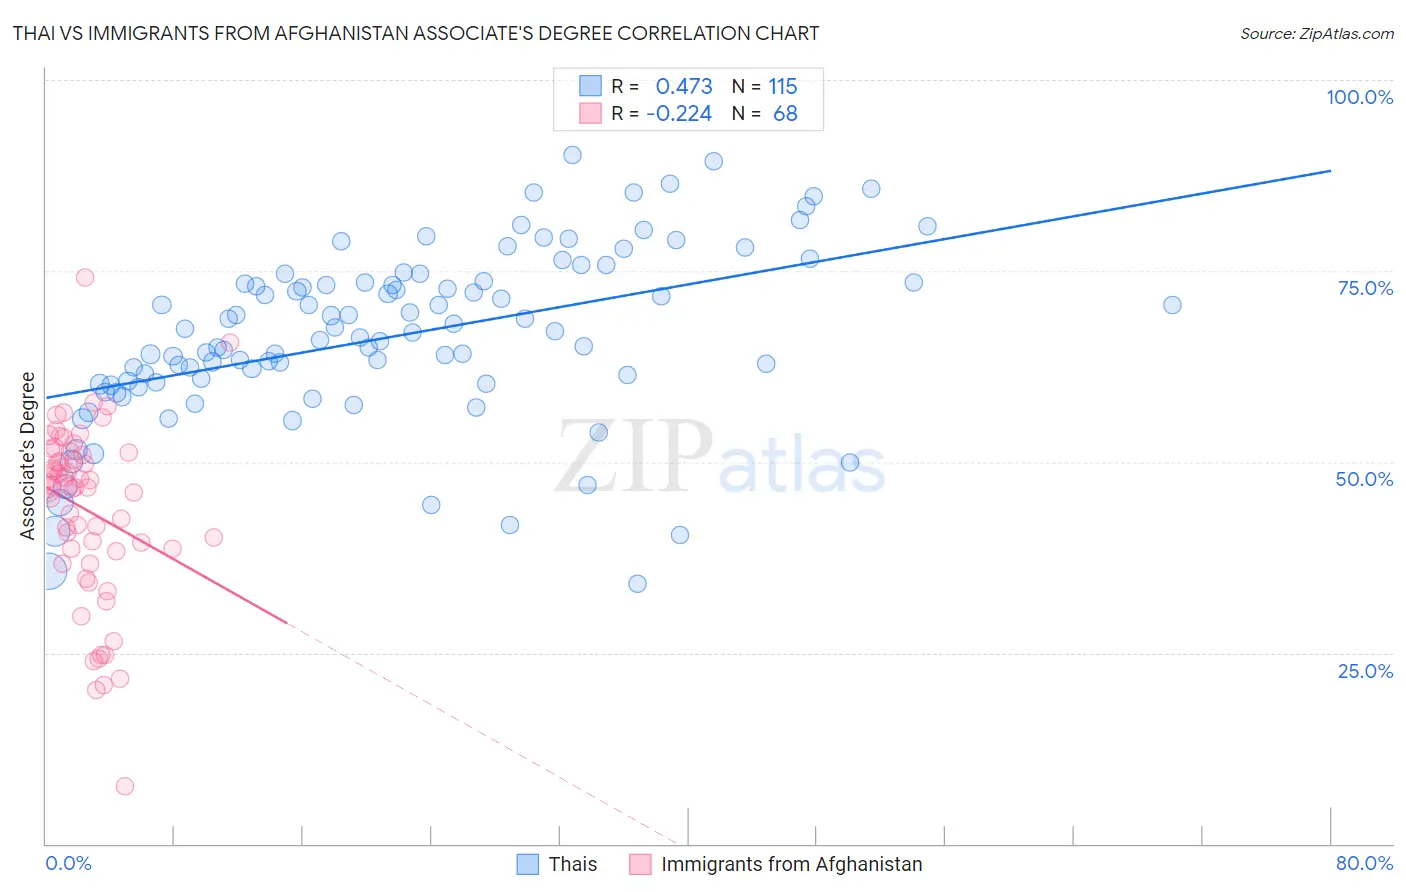
Thai vs Immigrants from Afghanistan Associate's Degree Correlation Chart
The statistical analysis conducted on geographies consisting of 475,760,266 people shows a moderate positive correlation between the proportion of Thais and percentage of population with at least associate's degree education in the United States with a correlation coefficient (R) of 0.473 and weighted average of 57.4%. Similarly, the statistical analysis conducted on geographies consisting of 147,646,385 people shows a weak negative correlation between the proportion of Immigrants from Afghanistan and percentage of population with at least associate's degree education in the United States with a correlation coefficient (R) of -0.224 and weighted average of 47.3%, a difference of 21.5%.
Associate's Degree Correlation Summary
| Measurement | Thai | Immigrants from Afghanistan |
| Minimum | 34.0% | 7.6% |
| Maximum | 90.2% | 74.2% |
| Range | 56.3% | 66.6% |
| Mean | 66.5% | 43.7% |
| Median | 66.9% | 46.7% |
| Interquartile 25% (IQ1) | 60.1% | 38.4% |
| Interquartile 75% (IQ3) | 73.5% | 51.1% |
| Interquartile Range (IQR) | 13.3% | 12.7% |
| Standard Deviation (Sample) | 11.4% | 11.6% |
| Standard Deviation (Population) | 11.4% | 11.5% |
Similar Demographics by Associate's Degree
Demographics Similar to Thais by Associate's Degree
In terms of associate's degree, the demographic groups most similar to Thais are Immigrants from Iran (57.7%, a difference of 0.40%), Okinawan (57.7%, a difference of 0.46%), Immigrants from Israel (56.8%, a difference of 1.1%), Iranian (58.2%, a difference of 1.3%), and Immigrants from Taiwan (58.4%, a difference of 1.7%).
| Demographics | Rating | Rank | Associate's Degree |
| Filipinos | 100.0 /100 | #1 | Exceptional 59.8% |
| Immigrants | Singapore | 100.0 /100 | #2 | Exceptional 58.9% |
| Immigrants | India | 100.0 /100 | #3 | Exceptional 58.5% |
| Immigrants | Taiwan | 100.0 /100 | #4 | Exceptional 58.4% |
| Iranians | 100.0 /100 | #5 | Exceptional 58.2% |
| Okinawans | 100.0 /100 | #6 | Exceptional 57.7% |
| Immigrants | Iran | 100.0 /100 | #7 | Exceptional 57.7% |
| Thais | 100.0 /100 | #8 | Exceptional 57.4% |
| Immigrants | Israel | 100.0 /100 | #9 | Exceptional 56.8% |
| Cypriots | 100.0 /100 | #10 | Exceptional 56.4% |
| Immigrants | Australia | 100.0 /100 | #11 | Exceptional 55.8% |
| Immigrants | South Central Asia | 100.0 /100 | #12 | Exceptional 55.7% |
| Immigrants | China | 100.0 /100 | #13 | Exceptional 55.5% |
| Immigrants | Hong Kong | 100.0 /100 | #14 | Exceptional 55.4% |
| Immigrants | Eastern Asia | 100.0 /100 | #15 | Exceptional 55.4% |
Demographics Similar to Immigrants from Afghanistan by Associate's Degree
In terms of associate's degree, the demographic groups most similar to Immigrants from Afghanistan are Immigrants from North Macedonia (47.4%, a difference of 0.17%), Iraqi (47.4%, a difference of 0.19%), Czech (47.2%, a difference of 0.19%), Immigrants from Kenya (47.2%, a difference of 0.20%), and Immigrants from Armenia (47.4%, a difference of 0.23%).
| Demographics | Rating | Rank | Associate's Degree |
| Canadians | 79.0 /100 | #145 | Good 47.5% |
| Immigrants | Sudan | 77.9 /100 | #146 | Good 47.4% |
| Danes | 77.3 /100 | #147 | Good 47.4% |
| South American Indians | 76.7 /100 | #148 | Good 47.4% |
| Immigrants | Armenia | 76.6 /100 | #149 | Good 47.4% |
| Iraqis | 76.2 /100 | #150 | Good 47.4% |
| Immigrants | North Macedonia | 76.0 /100 | #151 | Good 47.4% |
| Immigrants | Afghanistan | 74.3 /100 | #152 | Good 47.3% |
| Czechs | 72.2 /100 | #153 | Good 47.2% |
| Immigrants | Kenya | 72.1 /100 | #154 | Good 47.2% |
| Kenyans | 70.6 /100 | #155 | Good 47.1% |
| South Americans | 70.5 /100 | #156 | Good 47.1% |
| Sudanese | 70.3 /100 | #157 | Good 47.1% |
| Immigrants | Germany | 69.7 /100 | #158 | Good 47.1% |
| Immigrants | Poland | 69.2 /100 | #159 | Good 47.1% |