Syrian vs Immigrants from Poland Family Poverty
COMPARE
Syrian
Immigrants from Poland
Family Poverty
Family Poverty Comparison
Syrians
Immigrants from Poland
8.6%
FAMILY POVERTY
80.3/ 100
METRIC RATING
150th/ 347
METRIC RANK
7.9%
FAMILY POVERTY
97.8/ 100
METRIC RATING
82nd/ 347
METRIC RANK
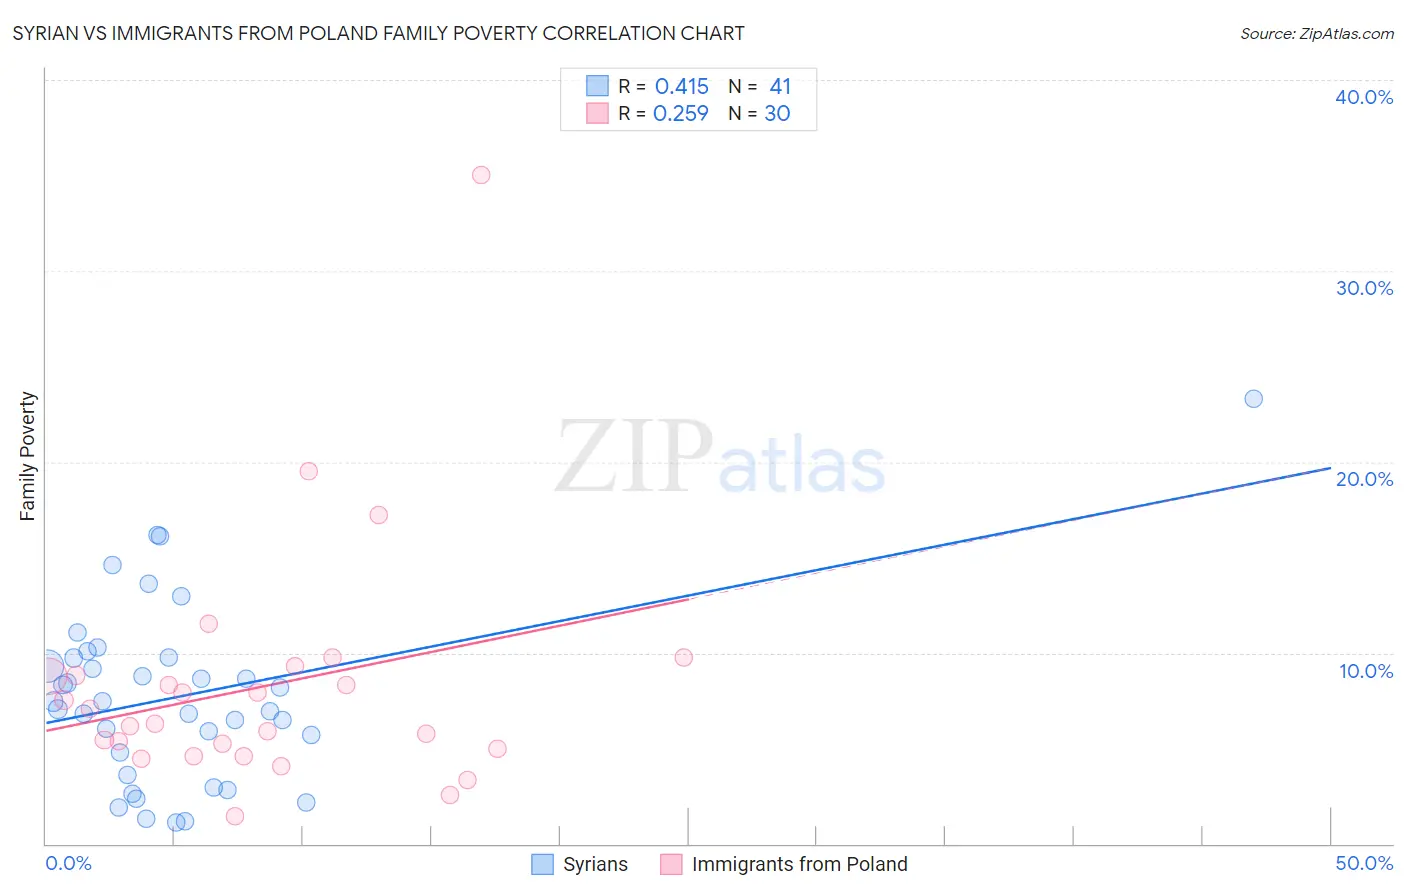
Syrian vs Immigrants from Poland Family Poverty Correlation Chart
The statistical analysis conducted on geographies consisting of 265,791,569 people shows a moderate positive correlation between the proportion of Syrians and poverty level among families in the United States with a correlation coefficient (R) of 0.415 and weighted average of 8.6%. Similarly, the statistical analysis conducted on geographies consisting of 304,048,718 people shows a weak positive correlation between the proportion of Immigrants from Poland and poverty level among families in the United States with a correlation coefficient (R) of 0.259 and weighted average of 7.9%, a difference of 8.9%.
Family Poverty Correlation Summary
| Measurement | Syrian | Immigrants from Poland |
| Minimum | 1.1% | 1.5% |
| Maximum | 23.3% | 35.0% |
| Range | 22.3% | 33.5% |
| Mean | 7.7% | 8.2% |
| Median | 7.4% | 6.7% |
| Interquartile 25% (IQ1) | 4.2% | 5.0% |
| Interquartile 75% (IQ3) | 9.7% | 8.8% |
| Interquartile Range (IQR) | 5.6% | 3.8% |
| Standard Deviation (Sample) | 4.7% | 6.3% |
| Standard Deviation (Population) | 4.6% | 6.2% |
Similar Demographics by Family Poverty
Demographics Similar to Syrians by Family Poverty
In terms of family poverty, the demographic groups most similar to Syrians are Mongolian (8.6%, a difference of 0.0%), Brazilian (8.6%, a difference of 0.050%), Samoan (8.6%, a difference of 0.13%), Immigrants from Spain (8.6%, a difference of 0.26%), and Scotch-Irish (8.6%, a difference of 0.41%).
| Demographics | Rating | Rank | Family Poverty |
| Immigrants | Germany | 83.3 /100 | #143 | Excellent 8.5% |
| Albanians | 83.3 /100 | #144 | Excellent 8.5% |
| Immigrants | South Eastern Asia | 83.2 /100 | #145 | Excellent 8.5% |
| Immigrants | Belarus | 83.2 /100 | #146 | Excellent 8.5% |
| Immigrants | Jordan | 83.0 /100 | #147 | Excellent 8.5% |
| Scotch-Irish | 82.2 /100 | #148 | Excellent 8.6% |
| Mongolians | 80.4 /100 | #149 | Excellent 8.6% |
| Syrians | 80.3 /100 | #150 | Excellent 8.6% |
| Brazilians | 80.1 /100 | #151 | Excellent 8.6% |
| Samoans | 79.8 /100 | #152 | Good 8.6% |
| Immigrants | Spain | 79.1 /100 | #153 | Good 8.6% |
| Immigrants | Vietnam | 75.4 /100 | #154 | Good 8.7% |
| Immigrants | Kuwait | 73.6 /100 | #155 | Good 8.7% |
| Immigrants | Oceania | 71.2 /100 | #156 | Good 8.7% |
| Tsimshian | 69.3 /100 | #157 | Good 8.8% |
Demographics Similar to Immigrants from Poland by Family Poverty
In terms of family poverty, the demographic groups most similar to Immigrants from Poland are English (7.9%, a difference of 0.030%), Irish (7.9%, a difference of 0.030%), Immigrants from Europe (7.9%, a difference of 0.090%), Immigrants from North America (7.9%, a difference of 0.17%), and Slovak (7.9%, a difference of 0.18%).
| Demographics | Rating | Rank | Family Poverty |
| Immigrants | Croatia | 98.1 /100 | #75 | Exceptional 7.8% |
| Immigrants | Latvia | 98.0 /100 | #76 | Exceptional 7.9% |
| Ukrainians | 98.0 /100 | #77 | Exceptional 7.9% |
| Immigrants | North America | 97.9 /100 | #78 | Exceptional 7.9% |
| Immigrants | Europe | 97.8 /100 | #79 | Exceptional 7.9% |
| English | 97.8 /100 | #80 | Exceptional 7.9% |
| Irish | 97.8 /100 | #81 | Exceptional 7.9% |
| Immigrants | Poland | 97.8 /100 | #82 | Exceptional 7.9% |
| Slovaks | 97.7 /100 | #83 | Exceptional 7.9% |
| British | 97.5 /100 | #84 | Exceptional 7.9% |
| Immigrants | Asia | 97.4 /100 | #85 | Exceptional 7.9% |
| Scottish | 97.3 /100 | #86 | Exceptional 7.9% |
| Belgians | 97.3 /100 | #87 | Exceptional 8.0% |
| Serbians | 97.2 /100 | #88 | Exceptional 8.0% |
| Immigrants | Denmark | 97.1 /100 | #89 | Exceptional 8.0% |