Subsaharan African vs Immigrants from Poland Female Disability
COMPARE
Subsaharan African
Immigrants from Poland
Female Disability
Female Disability Comparison
Sub-Saharan Africans
Immigrants from Poland
12.7%
FEMALE DISABILITY
1.0/ 100
METRIC RATING
260th/ 347
METRIC RANK
11.6%
FEMALE DISABILITY
99.6/ 100
METRIC RATING
84th/ 347
METRIC RANK
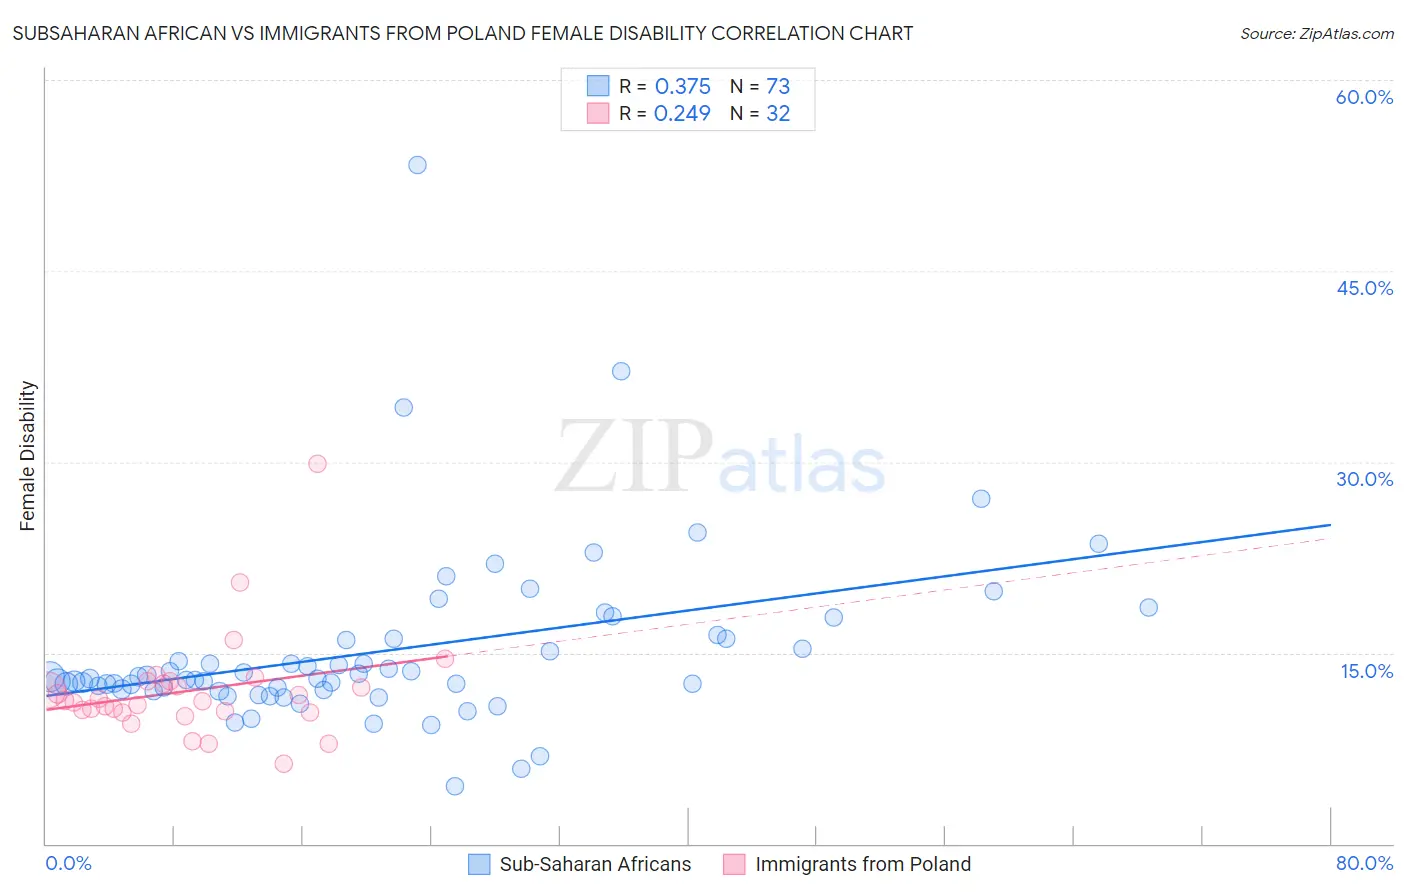
Subsaharan African vs Immigrants from Poland Female Disability Correlation Chart
The statistical analysis conducted on geographies consisting of 508,044,435 people shows a mild positive correlation between the proportion of Sub-Saharan Africans and percentage of females with a disability in the United States with a correlation coefficient (R) of 0.375 and weighted average of 12.7%. Similarly, the statistical analysis conducted on geographies consisting of 304,835,870 people shows a weak positive correlation between the proportion of Immigrants from Poland and percentage of females with a disability in the United States with a correlation coefficient (R) of 0.249 and weighted average of 11.6%, a difference of 10.0%.
Female Disability Correlation Summary
| Measurement | Subsaharan African | Immigrants from Poland |
| Minimum | 4.5% | 6.2% |
| Maximum | 53.3% | 29.8% |
| Range | 48.8% | 23.6% |
| Mean | 15.1% | 12.0% |
| Median | 12.9% | 11.2% |
| Interquartile 25% (IQ1) | 12.1% | 10.4% |
| Interquartile 75% (IQ3) | 16.1% | 12.7% |
| Interquartile Range (IQR) | 4.0% | 2.3% |
| Standard Deviation (Sample) | 7.0% | 4.1% |
| Standard Deviation (Population) | 7.0% | 4.1% |
Similar Demographics by Female Disability
Demographics Similar to Sub-Saharan Africans by Female Disability
In terms of female disability, the demographic groups most similar to Sub-Saharan Africans are Immigrants from Armenia (12.7%, a difference of 0.010%), Bermudan (12.7%, a difference of 0.040%), Aleut (12.7%, a difference of 0.090%), Liberian (12.7%, a difference of 0.10%), and Czechoslovakian (12.7%, a difference of 0.11%).
| Demographics | Rating | Rank | Female Disability |
| Jamaicans | 1.4 /100 | #253 | Tragic 12.7% |
| Hawaiians | 1.4 /100 | #254 | Tragic 12.7% |
| Immigrants | Germany | 1.3 /100 | #255 | Tragic 12.7% |
| British West Indians | 1.2 /100 | #256 | Tragic 12.7% |
| Liberians | 1.1 /100 | #257 | Tragic 12.7% |
| Aleuts | 1.1 /100 | #258 | Tragic 12.7% |
| Immigrants | Armenia | 1.0 /100 | #259 | Tragic 12.7% |
| Sub-Saharan Africans | 1.0 /100 | #260 | Tragic 12.7% |
| Bermudans | 1.0 /100 | #261 | Tragic 12.7% |
| Czechoslovakians | 0.9 /100 | #262 | Tragic 12.7% |
| Spaniards | 0.7 /100 | #263 | Tragic 12.8% |
| Alaska Natives | 0.6 /100 | #264 | Tragic 12.8% |
| West Indians | 0.5 /100 | #265 | Tragic 12.8% |
| Finns | 0.4 /100 | #266 | Tragic 12.8% |
| Senegalese | 0.4 /100 | #267 | Tragic 12.8% |
Demographics Similar to Immigrants from Poland by Female Disability
In terms of female disability, the demographic groups most similar to Immigrants from Poland are Immigrants from Serbia (11.6%, a difference of 0.030%), Palestinian (11.6%, a difference of 0.030%), Immigrants from Cameroon (11.6%, a difference of 0.040%), Luxembourger (11.6%, a difference of 0.050%), and Immigrants from Denmark (11.6%, a difference of 0.10%).
| Demographics | Rating | Rank | Female Disability |
| Immigrants | Afghanistan | 99.7 /100 | #77 | Exceptional 11.5% |
| Immigrants | South Africa | 99.7 /100 | #78 | Exceptional 11.5% |
| Sierra Leoneans | 99.7 /100 | #79 | Exceptional 11.5% |
| Immigrants | Jordan | 99.7 /100 | #80 | Exceptional 11.5% |
| Eastern Europeans | 99.7 /100 | #81 | Exceptional 11.5% |
| Luxembourgers | 99.6 /100 | #82 | Exceptional 11.6% |
| Immigrants | Serbia | 99.6 /100 | #83 | Exceptional 11.6% |
| Immigrants | Poland | 99.6 /100 | #84 | Exceptional 11.6% |
| Palestinians | 99.6 /100 | #85 | Exceptional 11.6% |
| Immigrants | Cameroon | 99.6 /100 | #86 | Exceptional 11.6% |
| Immigrants | Denmark | 99.5 /100 | #87 | Exceptional 11.6% |
| Yup'ik | 99.5 /100 | #88 | Exceptional 11.6% |
| Vietnamese | 99.5 /100 | #89 | Exceptional 11.6% |
| Immigrants | Romania | 99.5 /100 | #90 | Exceptional 11.6% |
| Immigrants | Zimbabwe | 99.5 /100 | #91 | Exceptional 11.6% |