Turkish vs Immigrants from Poland Female Disability
COMPARE
Turkish
Immigrants from Poland
Female Disability
Female Disability Comparison
Turks
Immigrants from Poland
11.1%
FEMALE DISABILITY
100.0/ 100
METRIC RATING
30th/ 347
METRIC RANK
11.6%
FEMALE DISABILITY
99.6/ 100
METRIC RATING
84th/ 347
METRIC RANK
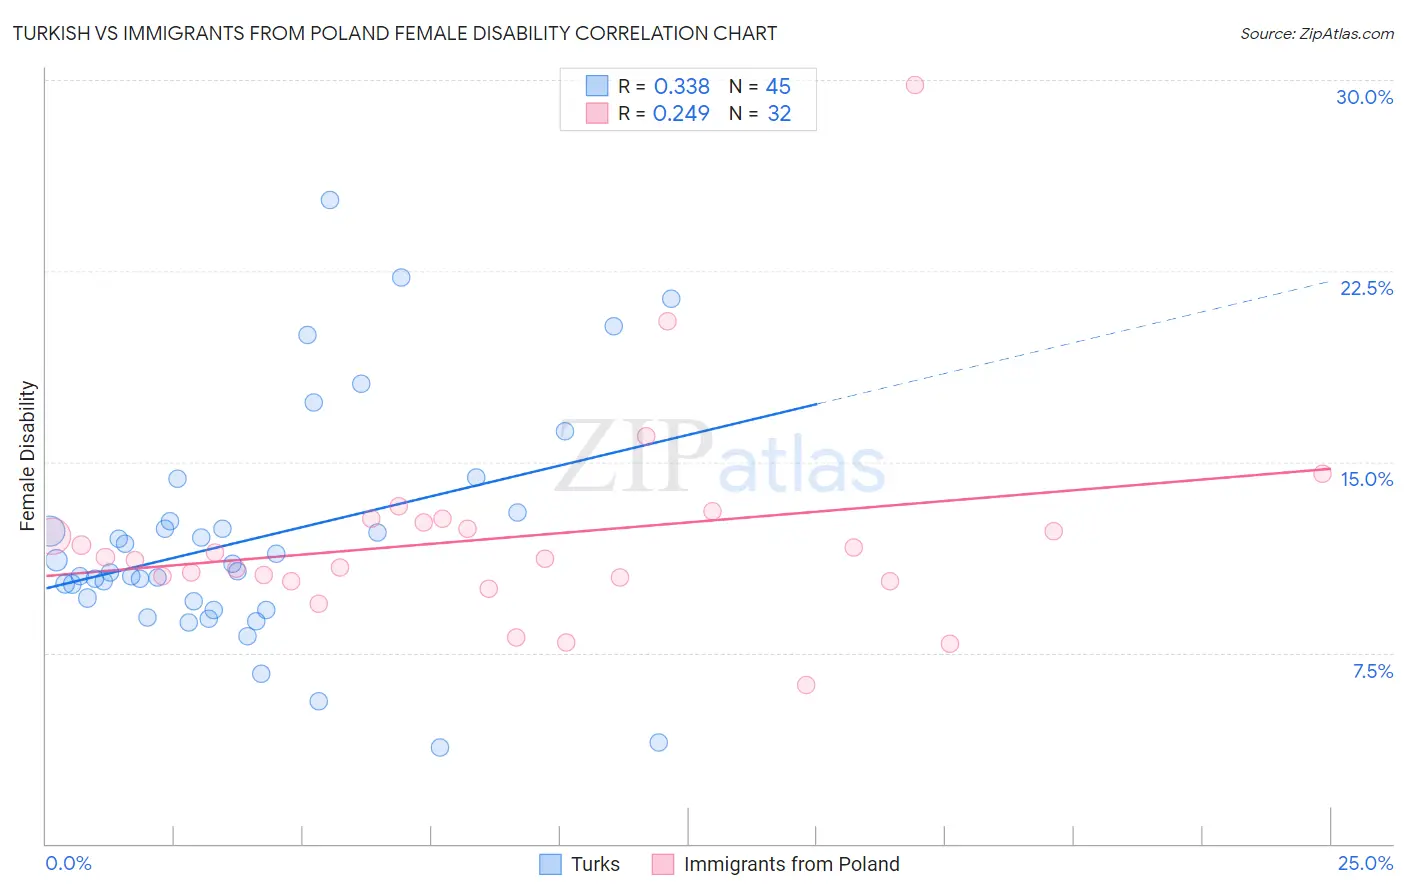
Turkish vs Immigrants from Poland Female Disability Correlation Chart
The statistical analysis conducted on geographies consisting of 271,848,470 people shows a mild positive correlation between the proportion of Turks and percentage of females with a disability in the United States with a correlation coefficient (R) of 0.338 and weighted average of 11.1%. Similarly, the statistical analysis conducted on geographies consisting of 304,835,870 people shows a weak positive correlation between the proportion of Immigrants from Poland and percentage of females with a disability in the United States with a correlation coefficient (R) of 0.249 and weighted average of 11.6%, a difference of 4.2%.
Female Disability Correlation Summary
| Measurement | Turkish | Immigrants from Poland |
| Minimum | 3.8% | 6.2% |
| Maximum | 25.3% | 29.8% |
| Range | 21.5% | 23.6% |
| Mean | 12.0% | 12.0% |
| Median | 10.7% | 11.2% |
| Interquartile 25% (IQ1) | 9.4% | 10.4% |
| Interquartile 75% (IQ3) | 12.8% | 12.7% |
| Interquartile Range (IQR) | 3.5% | 2.3% |
| Standard Deviation (Sample) | 4.5% | 4.1% |
| Standard Deviation (Population) | 4.5% | 4.1% |
Similar Demographics by Female Disability
Demographics Similar to Turks by Female Disability
In terms of female disability, the demographic groups most similar to Turks are Immigrants from Malaysia (11.1%, a difference of 0.0%), Egyptian (11.1%, a difference of 0.070%), Immigrants from Kuwait (11.1%, a difference of 0.10%), Immigrants from Australia (11.1%, a difference of 0.27%), and Immigrants from Turkey (11.1%, a difference of 0.34%).
| Demographics | Rating | Rank | Female Disability |
| Venezuelans | 100.0 /100 | #23 | Exceptional 11.0% |
| Immigrants | Argentina | 100.0 /100 | #24 | Exceptional 11.0% |
| Immigrants | Asia | 100.0 /100 | #25 | Exceptional 11.0% |
| Argentineans | 100.0 /100 | #26 | Exceptional 11.0% |
| Immigrants | Turkey | 100.0 /100 | #27 | Exceptional 11.1% |
| Egyptians | 100.0 /100 | #28 | Exceptional 11.1% |
| Immigrants | Malaysia | 100.0 /100 | #29 | Exceptional 11.1% |
| Turks | 100.0 /100 | #30 | Exceptional 11.1% |
| Immigrants | Kuwait | 100.0 /100 | #31 | Exceptional 11.1% |
| Immigrants | Australia | 100.0 /100 | #32 | Exceptional 11.1% |
| Immigrants | Egypt | 100.0 /100 | #33 | Exceptional 11.1% |
| Immigrants | Indonesia | 100.0 /100 | #34 | Exceptional 11.2% |
| Immigrants | Japan | 100.0 /100 | #35 | Exceptional 11.2% |
| Cypriots | 100.0 /100 | #36 | Exceptional 11.2% |
| Ethiopians | 100.0 /100 | #37 | Exceptional 11.2% |
Demographics Similar to Immigrants from Poland by Female Disability
In terms of female disability, the demographic groups most similar to Immigrants from Poland are Immigrants from Serbia (11.6%, a difference of 0.030%), Palestinian (11.6%, a difference of 0.030%), Immigrants from Cameroon (11.6%, a difference of 0.040%), Luxembourger (11.6%, a difference of 0.050%), and Immigrants from Denmark (11.6%, a difference of 0.10%).
| Demographics | Rating | Rank | Female Disability |
| Immigrants | Afghanistan | 99.7 /100 | #77 | Exceptional 11.5% |
| Immigrants | South Africa | 99.7 /100 | #78 | Exceptional 11.5% |
| Sierra Leoneans | 99.7 /100 | #79 | Exceptional 11.5% |
| Immigrants | Jordan | 99.7 /100 | #80 | Exceptional 11.5% |
| Eastern Europeans | 99.7 /100 | #81 | Exceptional 11.5% |
| Luxembourgers | 99.6 /100 | #82 | Exceptional 11.6% |
| Immigrants | Serbia | 99.6 /100 | #83 | Exceptional 11.6% |
| Immigrants | Poland | 99.6 /100 | #84 | Exceptional 11.6% |
| Palestinians | 99.6 /100 | #85 | Exceptional 11.6% |
| Immigrants | Cameroon | 99.6 /100 | #86 | Exceptional 11.6% |
| Immigrants | Denmark | 99.5 /100 | #87 | Exceptional 11.6% |
| Yup'ik | 99.5 /100 | #88 | Exceptional 11.6% |
| Vietnamese | 99.5 /100 | #89 | Exceptional 11.6% |
| Immigrants | Romania | 99.5 /100 | #90 | Exceptional 11.6% |
| Immigrants | Zimbabwe | 99.5 /100 | #91 | Exceptional 11.6% |