Syrian vs Immigrants from Mexico Self-Care Disability
COMPARE
Syrian
Immigrants from Mexico
Self-Care Disability
Self-Care Disability Comparison
Syrians
Immigrants from Mexico
2.5%
SELF-CARE DISABILITY
59.0/ 100
METRIC RATING
165th/ 347
METRIC RANK
2.7%
SELF-CARE DISABILITY
0.1/ 100
METRIC RATING
268th/ 347
METRIC RANK
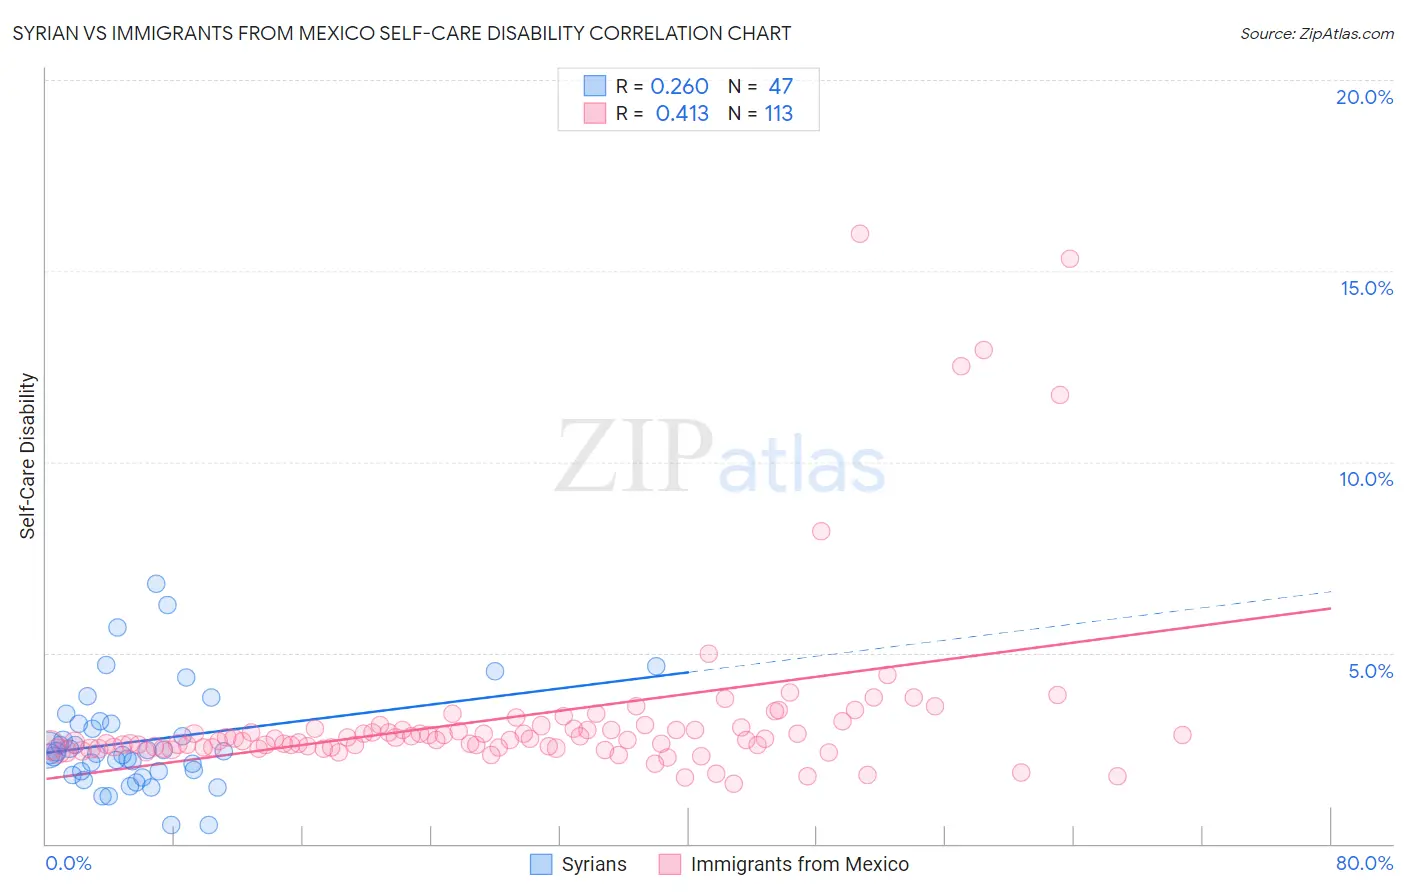
Syrian vs Immigrants from Mexico Self-Care Disability Correlation Chart
The statistical analysis conducted on geographies consisting of 266,133,932 people shows a weak positive correlation between the proportion of Syrians and percentage of population with self-care disability in the United States with a correlation coefficient (R) of 0.260 and weighted average of 2.5%. Similarly, the statistical analysis conducted on geographies consisting of 512,428,426 people shows a moderate positive correlation between the proportion of Immigrants from Mexico and percentage of population with self-care disability in the United States with a correlation coefficient (R) of 0.413 and weighted average of 2.7%, a difference of 8.5%.
Self-Care Disability Correlation Summary
| Measurement | Syrian | Immigrants from Mexico |
| Minimum | 0.49% | 1.6% |
| Maximum | 6.8% | 16.0% |
| Range | 6.3% | 14.4% |
| Mean | 2.7% | 3.3% |
| Median | 2.4% | 2.7% |
| Interquartile 25% (IQ1) | 1.9% | 2.5% |
| Interquartile 75% (IQ3) | 3.2% | 3.0% |
| Interquartile Range (IQR) | 1.3% | 0.48% |
| Standard Deviation (Sample) | 1.3% | 2.4% |
| Standard Deviation (Population) | 1.3% | 2.4% |
Similar Demographics by Self-Care Disability
Demographics Similar to Syrians by Self-Care Disability
In terms of self-care disability, the demographic groups most similar to Syrians are Canadian (2.5%, a difference of 0.010%), Immigrants from Vietnam (2.5%, a difference of 0.020%), Immigrants from Greece (2.5%, a difference of 0.080%), Ute (2.5%, a difference of 0.090%), and Immigrants from Somalia (2.5%, a difference of 0.15%).
| Demographics | Rating | Rank | Self-Care Disability |
| Immigrants | Western Europe | 68.6 /100 | #158 | Good 2.4% |
| Immigrants | Italy | 68.5 /100 | #159 | Good 2.4% |
| Finns | 67.0 /100 | #160 | Good 2.4% |
| Lebanese | 66.5 /100 | #161 | Good 2.4% |
| Somalis | 63.7 /100 | #162 | Good 2.5% |
| German Russians | 62.7 /100 | #163 | Good 2.5% |
| Immigrants | Vietnam | 59.3 /100 | #164 | Average 2.5% |
| Syrians | 59.0 /100 | #165 | Average 2.5% |
| Canadians | 58.8 /100 | #166 | Average 2.5% |
| Immigrants | Greece | 57.3 /100 | #167 | Average 2.5% |
| Ute | 57.1 /100 | #168 | Average 2.5% |
| Immigrants | Somalia | 55.9 /100 | #169 | Average 2.5% |
| Scottish | 54.3 /100 | #170 | Average 2.5% |
| Pennsylvania Germans | 53.5 /100 | #171 | Average 2.5% |
| Czechoslovakians | 53.5 /100 | #172 | Average 2.5% |
Demographics Similar to Immigrants from Mexico by Self-Care Disability
In terms of self-care disability, the demographic groups most similar to Immigrants from Mexico are Yaqui (2.7%, a difference of 0.050%), U.S. Virgin Islander (2.7%, a difference of 0.17%), Immigrants from Micronesia (2.7%, a difference of 0.21%), Immigrants from Cambodia (2.7%, a difference of 0.24%), and Trinidadian and Tobagonian (2.7%, a difference of 0.27%).
| Demographics | Rating | Rank | Self-Care Disability |
| Arapaho | 0.2 /100 | #261 | Tragic 2.6% |
| Shoshone | 0.2 /100 | #262 | Tragic 2.7% |
| Immigrants | Latin America | 0.2 /100 | #263 | Tragic 2.7% |
| Immigrants | Iran | 0.2 /100 | #264 | Tragic 2.7% |
| Immigrants | Nicaragua | 0.2 /100 | #265 | Tragic 2.7% |
| Immigrants | Cambodia | 0.1 /100 | #266 | Tragic 2.7% |
| Yaqui | 0.1 /100 | #267 | Tragic 2.7% |
| Immigrants | Mexico | 0.1 /100 | #268 | Tragic 2.7% |
| U.S. Virgin Islanders | 0.1 /100 | #269 | Tragic 2.7% |
| Immigrants | Micronesia | 0.1 /100 | #270 | Tragic 2.7% |
| Trinidadians and Tobagonians | 0.1 /100 | #271 | Tragic 2.7% |
| Immigrants | Laos | 0.1 /100 | #272 | Tragic 2.7% |
| Mexicans | 0.1 /100 | #273 | Tragic 2.7% |
| Yakama | 0.1 /100 | #274 | Tragic 2.7% |
| Immigrants | Trinidad and Tobago | 0.1 /100 | #275 | Tragic 2.7% |