Immigrants from Kuwait vs Immigrants from Mexico Self-Care Disability
COMPARE
Immigrants from Kuwait
Immigrants from Mexico
Self-Care Disability
Self-Care Disability Comparison
Immigrants from Kuwait
Immigrants from Mexico
2.2%
SELF-CARE DISABILITY
100.0/ 100
METRIC RATING
16th/ 347
METRIC RANK
2.7%
SELF-CARE DISABILITY
0.1/ 100
METRIC RATING
268th/ 347
METRIC RANK
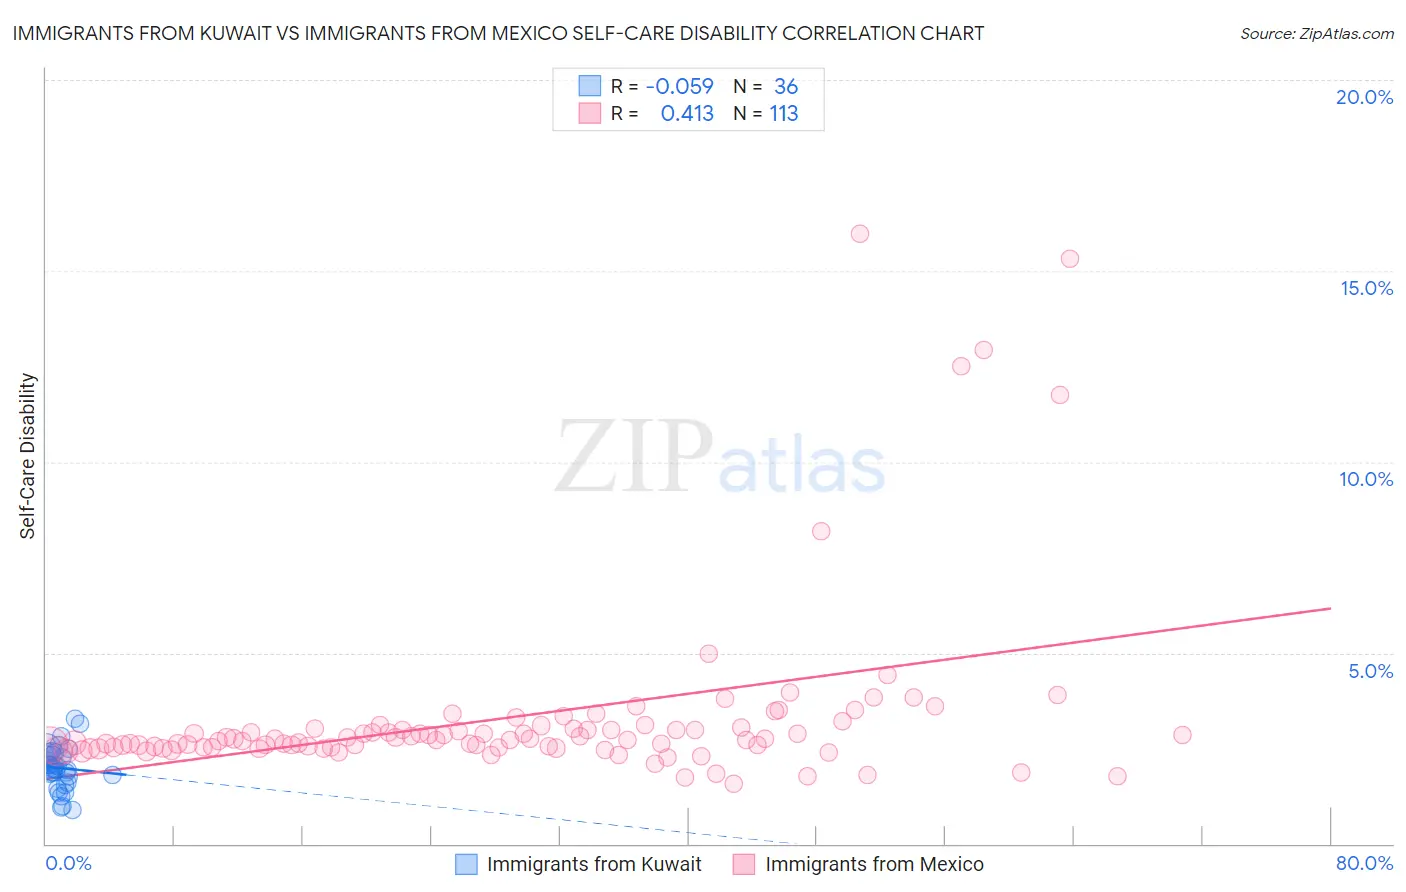
Immigrants from Kuwait vs Immigrants from Mexico Self-Care Disability Correlation Chart
The statistical analysis conducted on geographies consisting of 136,859,036 people shows a slight negative correlation between the proportion of Immigrants from Kuwait and percentage of population with self-care disability in the United States with a correlation coefficient (R) of -0.059 and weighted average of 2.2%. Similarly, the statistical analysis conducted on geographies consisting of 512,428,426 people shows a moderate positive correlation between the proportion of Immigrants from Mexico and percentage of population with self-care disability in the United States with a correlation coefficient (R) of 0.413 and weighted average of 2.7%, a difference of 20.9%.
Self-Care Disability Correlation Summary
| Measurement | Immigrants from Kuwait | Immigrants from Mexico |
| Minimum | 0.88% | 1.6% |
| Maximum | 3.3% | 16.0% |
| Range | 2.4% | 14.4% |
| Mean | 2.0% | 3.3% |
| Median | 2.0% | 2.7% |
| Interquartile 25% (IQ1) | 1.7% | 2.5% |
| Interquartile 75% (IQ3) | 2.3% | 3.0% |
| Interquartile Range (IQR) | 0.67% | 0.48% |
| Standard Deviation (Sample) | 0.56% | 2.4% |
| Standard Deviation (Population) | 0.55% | 2.4% |
Similar Demographics by Self-Care Disability
Demographics Similar to Immigrants from Kuwait by Self-Care Disability
In terms of self-care disability, the demographic groups most similar to Immigrants from Kuwait are Immigrants from Saudi Arabia (2.2%, a difference of 0.16%), Okinawan (2.2%, a difference of 0.28%), Luxembourger (2.2%, a difference of 0.29%), Immigrants from Taiwan (2.2%, a difference of 0.42%), and Ethiopian (2.2%, a difference of 0.45%).
| Demographics | Rating | Rank | Self-Care Disability |
| Immigrants | Nepal | 100.0 /100 | #9 | Exceptional 2.2% |
| Sudanese | 100.0 /100 | #10 | Exceptional 2.2% |
| Immigrants | South Central Asia | 100.0 /100 | #11 | Exceptional 2.2% |
| Immigrants | Ethiopia | 100.0 /100 | #12 | Exceptional 2.2% |
| Ethiopians | 100.0 /100 | #13 | Exceptional 2.2% |
| Luxembourgers | 100.0 /100 | #14 | Exceptional 2.2% |
| Okinawans | 100.0 /100 | #15 | Exceptional 2.2% |
| Immigrants | Kuwait | 100.0 /100 | #16 | Exceptional 2.2% |
| Immigrants | Saudi Arabia | 100.0 /100 | #17 | Exceptional 2.2% |
| Immigrants | Taiwan | 100.0 /100 | #18 | Exceptional 2.2% |
| Immigrants | Eritrea | 100.0 /100 | #19 | Exceptional 2.2% |
| Tongans | 100.0 /100 | #20 | Exceptional 2.2% |
| Bulgarians | 100.0 /100 | #21 | Exceptional 2.2% |
| Immigrants | Venezuela | 100.0 /100 | #22 | Exceptional 2.2% |
| Cambodians | 100.0 /100 | #23 | Exceptional 2.2% |
Demographics Similar to Immigrants from Mexico by Self-Care Disability
In terms of self-care disability, the demographic groups most similar to Immigrants from Mexico are Yaqui (2.7%, a difference of 0.050%), U.S. Virgin Islander (2.7%, a difference of 0.17%), Immigrants from Micronesia (2.7%, a difference of 0.21%), Immigrants from Cambodia (2.7%, a difference of 0.24%), and Trinidadian and Tobagonian (2.7%, a difference of 0.27%).
| Demographics | Rating | Rank | Self-Care Disability |
| Arapaho | 0.2 /100 | #261 | Tragic 2.6% |
| Shoshone | 0.2 /100 | #262 | Tragic 2.7% |
| Immigrants | Latin America | 0.2 /100 | #263 | Tragic 2.7% |
| Immigrants | Iran | 0.2 /100 | #264 | Tragic 2.7% |
| Immigrants | Nicaragua | 0.2 /100 | #265 | Tragic 2.7% |
| Immigrants | Cambodia | 0.1 /100 | #266 | Tragic 2.7% |
| Yaqui | 0.1 /100 | #267 | Tragic 2.7% |
| Immigrants | Mexico | 0.1 /100 | #268 | Tragic 2.7% |
| U.S. Virgin Islanders | 0.1 /100 | #269 | Tragic 2.7% |
| Immigrants | Micronesia | 0.1 /100 | #270 | Tragic 2.7% |
| Trinidadians and Tobagonians | 0.1 /100 | #271 | Tragic 2.7% |
| Immigrants | Laos | 0.1 /100 | #272 | Tragic 2.7% |
| Mexicans | 0.1 /100 | #273 | Tragic 2.7% |
| Yakama | 0.1 /100 | #274 | Tragic 2.7% |
| Immigrants | Trinidad and Tobago | 0.1 /100 | #275 | Tragic 2.7% |