Guatemalan vs Immigrants from Mexico Self-Care Disability
COMPARE
Guatemalan
Immigrants from Mexico
Self-Care Disability
Self-Care Disability Comparison
Guatemalans
Immigrants from Mexico
2.6%
SELF-CARE DISABILITY
2.7/ 100
METRIC RATING
228th/ 347
METRIC RANK
2.7%
SELF-CARE DISABILITY
0.1/ 100
METRIC RATING
268th/ 347
METRIC RANK
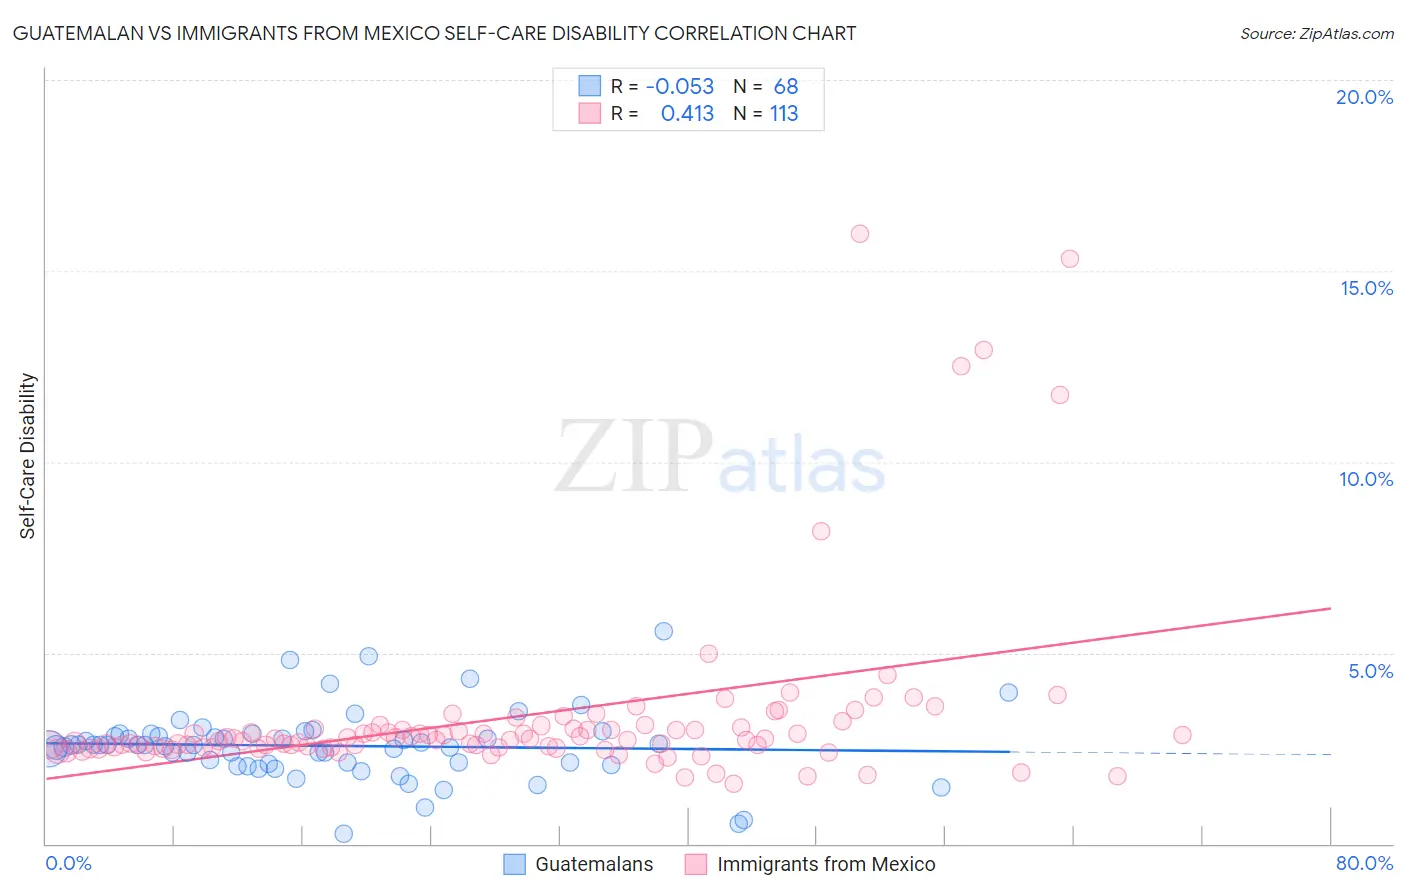
Guatemalan vs Immigrants from Mexico Self-Care Disability Correlation Chart
The statistical analysis conducted on geographies consisting of 408,997,178 people shows a slight negative correlation between the proportion of Guatemalans and percentage of population with self-care disability in the United States with a correlation coefficient (R) of -0.053 and weighted average of 2.6%. Similarly, the statistical analysis conducted on geographies consisting of 512,428,426 people shows a moderate positive correlation between the proportion of Immigrants from Mexico and percentage of population with self-care disability in the United States with a correlation coefficient (R) of 0.413 and weighted average of 2.7%, a difference of 3.6%.
Self-Care Disability Correlation Summary
| Measurement | Guatemalan | Immigrants from Mexico |
| Minimum | 0.26% | 1.6% |
| Maximum | 5.6% | 16.0% |
| Range | 5.3% | 14.4% |
| Mean | 2.6% | 3.3% |
| Median | 2.6% | 2.7% |
| Interquartile 25% (IQ1) | 2.1% | 2.5% |
| Interquartile 75% (IQ3) | 2.8% | 3.0% |
| Interquartile Range (IQR) | 0.73% | 0.48% |
| Standard Deviation (Sample) | 0.92% | 2.4% |
| Standard Deviation (Population) | 0.91% | 2.4% |
Similar Demographics by Self-Care Disability
Demographics Similar to Guatemalans by Self-Care Disability
In terms of self-care disability, the demographic groups most similar to Guatemalans are Immigrants from Philippines (2.6%, a difference of 0.010%), Guamanian/Chamorro (2.6%, a difference of 0.070%), Immigrants from Ecuador (2.6%, a difference of 0.080%), Chinese (2.6%, a difference of 0.090%), and Iraqi (2.6%, a difference of 0.19%).
| Demographics | Rating | Rank | Self-Care Disability |
| Hondurans | 3.8 /100 | #221 | Tragic 2.6% |
| Spaniards | 3.8 /100 | #222 | Tragic 2.6% |
| French Canadians | 3.8 /100 | #223 | Tragic 2.6% |
| Osage | 3.6 /100 | #224 | Tragic 2.6% |
| Iraqis | 3.2 /100 | #225 | Tragic 2.6% |
| Chinese | 2.9 /100 | #226 | Tragic 2.6% |
| Immigrants | Philippines | 2.7 /100 | #227 | Tragic 2.6% |
| Guatemalans | 2.7 /100 | #228 | Tragic 2.6% |
| Guamanians/Chamorros | 2.5 /100 | #229 | Tragic 2.6% |
| Immigrants | Ecuador | 2.5 /100 | #230 | Tragic 2.6% |
| Immigrants | Guatemala | 2.2 /100 | #231 | Tragic 2.6% |
| Albanians | 2.2 /100 | #232 | Tragic 2.6% |
| Liberians | 2.1 /100 | #233 | Tragic 2.6% |
| Vietnamese | 2.1 /100 | #234 | Tragic 2.6% |
| Bahamians | 2.0 /100 | #235 | Tragic 2.6% |
Demographics Similar to Immigrants from Mexico by Self-Care Disability
In terms of self-care disability, the demographic groups most similar to Immigrants from Mexico are Yaqui (2.7%, a difference of 0.050%), U.S. Virgin Islander (2.7%, a difference of 0.17%), Immigrants from Micronesia (2.7%, a difference of 0.21%), Immigrants from Cambodia (2.7%, a difference of 0.24%), and Trinidadian and Tobagonian (2.7%, a difference of 0.27%).
| Demographics | Rating | Rank | Self-Care Disability |
| Arapaho | 0.2 /100 | #261 | Tragic 2.6% |
| Shoshone | 0.2 /100 | #262 | Tragic 2.7% |
| Immigrants | Latin America | 0.2 /100 | #263 | Tragic 2.7% |
| Immigrants | Iran | 0.2 /100 | #264 | Tragic 2.7% |
| Immigrants | Nicaragua | 0.2 /100 | #265 | Tragic 2.7% |
| Immigrants | Cambodia | 0.1 /100 | #266 | Tragic 2.7% |
| Yaqui | 0.1 /100 | #267 | Tragic 2.7% |
| Immigrants | Mexico | 0.1 /100 | #268 | Tragic 2.7% |
| U.S. Virgin Islanders | 0.1 /100 | #269 | Tragic 2.7% |
| Immigrants | Micronesia | 0.1 /100 | #270 | Tragic 2.7% |
| Trinidadians and Tobagonians | 0.1 /100 | #271 | Tragic 2.7% |
| Immigrants | Laos | 0.1 /100 | #272 | Tragic 2.7% |
| Mexicans | 0.1 /100 | #273 | Tragic 2.7% |
| Yakama | 0.1 /100 | #274 | Tragic 2.7% |
| Immigrants | Trinidad and Tobago | 0.1 /100 | #275 | Tragic 2.7% |