Immigrants from Pakistan vs Immigrants from Moldova Vision Disability
COMPARE
Immigrants from Pakistan
Immigrants from Moldova
Vision Disability
Vision Disability Comparison
Immigrants from Pakistan
Immigrants from Moldova
1.9%
VISION DISABILITY
100.0/ 100
METRIC RATING
22nd/ 347
METRIC RANK
2.0%
VISION DISABILITY
97.2/ 100
METRIC RATING
86th/ 347
METRIC RANK
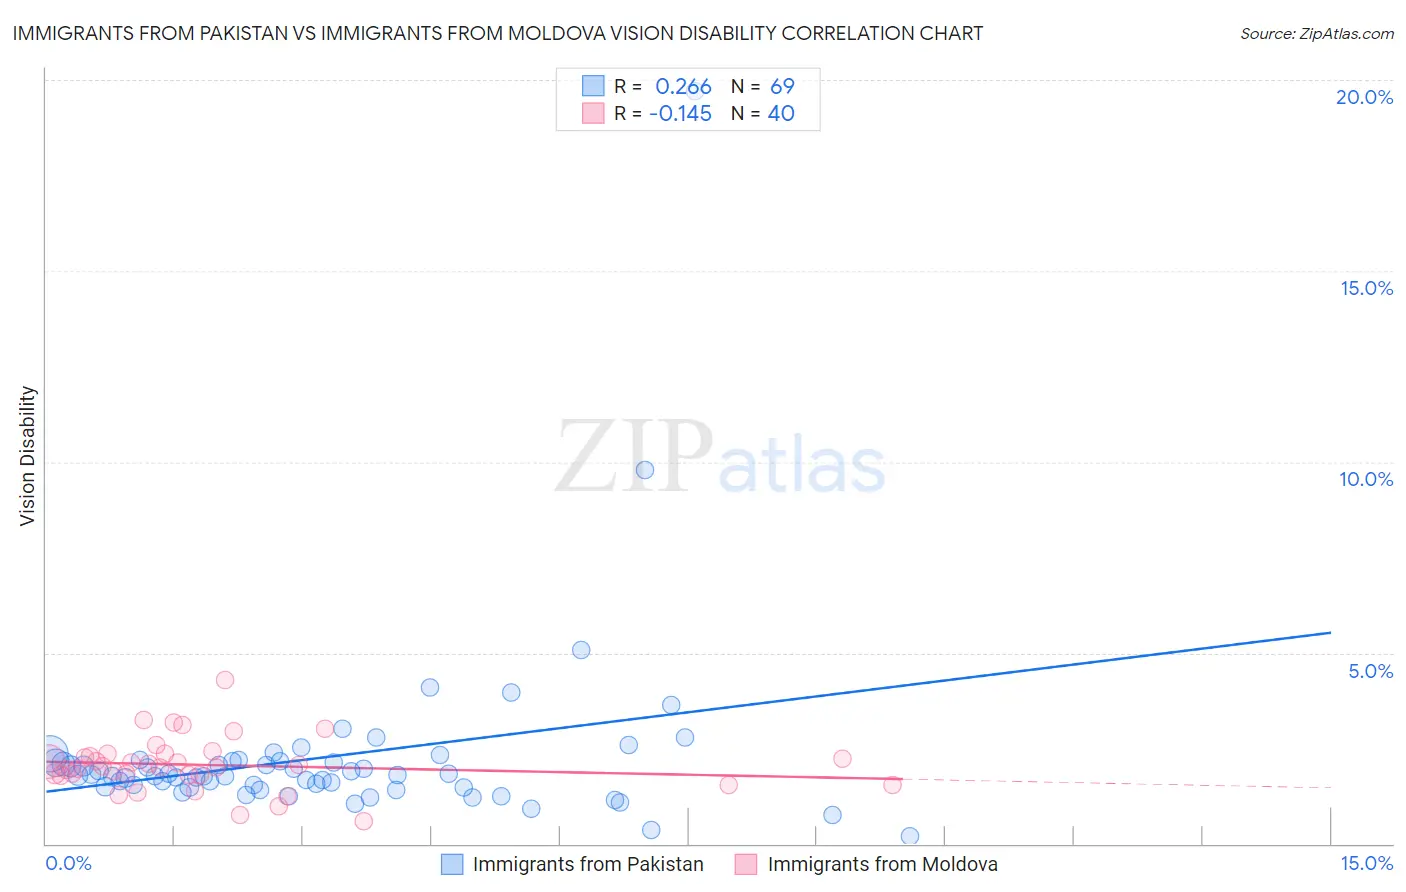
Immigrants from Pakistan vs Immigrants from Moldova Vision Disability Correlation Chart
The statistical analysis conducted on geographies consisting of 283,768,855 people shows a weak positive correlation between the proportion of Immigrants from Pakistan and percentage of population with vision disability in the United States with a correlation coefficient (R) of 0.266 and weighted average of 1.9%. Similarly, the statistical analysis conducted on geographies consisting of 124,355,490 people shows a poor negative correlation between the proportion of Immigrants from Moldova and percentage of population with vision disability in the United States with a correlation coefficient (R) of -0.145 and weighted average of 2.0%, a difference of 7.3%.
Vision Disability Correlation Summary
| Measurement | Immigrants from Pakistan | Immigrants from Moldova |
| Minimum | 0.21% | 0.59% |
| Maximum | 19.7% | 4.3% |
| Range | 19.5% | 3.7% |
| Mean | 2.3% | 2.1% |
| Median | 1.8% | 2.0% |
| Interquartile 25% (IQ1) | 1.5% | 1.8% |
| Interquartile 75% (IQ3) | 2.2% | 2.3% |
| Interquartile Range (IQR) | 0.69% | 0.53% |
| Standard Deviation (Sample) | 2.5% | 0.71% |
| Standard Deviation (Population) | 2.4% | 0.70% |
Similar Demographics by Vision Disability
Demographics Similar to Immigrants from Pakistan by Vision Disability
In terms of vision disability, the demographic groups most similar to Immigrants from Pakistan are Turkish (1.9%, a difference of 0.050%), Asian (1.9%, a difference of 0.35%), Immigrants from Asia (1.9%, a difference of 0.54%), Immigrants from Lithuania (1.9%, a difference of 0.66%), and Bulgarian (1.9%, a difference of 0.70%).
| Demographics | Rating | Rank | Vision Disability |
| Immigrants | Bolivia | 100.0 /100 | #15 | Exceptional 1.8% |
| Indians (Asian) | 100.0 /100 | #16 | Exceptional 1.8% |
| Burmese | 100.0 /100 | #17 | Exceptional 1.8% |
| Bolivians | 100.0 /100 | #18 | Exceptional 1.9% |
| Immigrants | Sri Lanka | 100.0 /100 | #19 | Exceptional 1.9% |
| Asians | 100.0 /100 | #20 | Exceptional 1.9% |
| Turks | 100.0 /100 | #21 | Exceptional 1.9% |
| Immigrants | Pakistan | 100.0 /100 | #22 | Exceptional 1.9% |
| Immigrants | Asia | 99.9 /100 | #23 | Exceptional 1.9% |
| Immigrants | Lithuania | 99.9 /100 | #24 | Exceptional 1.9% |
| Bulgarians | 99.9 /100 | #25 | Exceptional 1.9% |
| Immigrants | Japan | 99.9 /100 | #26 | Exceptional 1.9% |
| Taiwanese | 99.9 /100 | #27 | Exceptional 1.9% |
| Immigrants | Malaysia | 99.9 /100 | #28 | Exceptional 1.9% |
| Egyptians | 99.9 /100 | #29 | Exceptional 1.9% |
Demographics Similar to Immigrants from Moldova by Vision Disability
In terms of vision disability, the demographic groups most similar to Immigrants from Moldova are Chinese (2.0%, a difference of 0.020%), Immigrants from Switzerland (2.0%, a difference of 0.060%), Norwegian (2.0%, a difference of 0.070%), Immigrants from Latvia (2.0%, a difference of 0.080%), and Immigrants from Eastern Africa (2.0%, a difference of 0.11%).
| Demographics | Rating | Rank | Vision Disability |
| Assyrians/Chaldeans/Syriacs | 98.1 /100 | #79 | Exceptional 2.0% |
| Lithuanians | 97.7 /100 | #80 | Exceptional 2.0% |
| Soviet Union | 97.6 /100 | #81 | Exceptional 2.0% |
| Immigrants | Poland | 97.6 /100 | #82 | Exceptional 2.0% |
| Immigrants | Western Asia | 97.5 /100 | #83 | Exceptional 2.0% |
| Immigrants | Latvia | 97.3 /100 | #84 | Exceptional 2.0% |
| Chinese | 97.2 /100 | #85 | Exceptional 2.0% |
| Immigrants | Moldova | 97.2 /100 | #86 | Exceptional 2.0% |
| Immigrants | Switzerland | 97.0 /100 | #87 | Exceptional 2.0% |
| Norwegians | 97.0 /100 | #88 | Exceptional 2.0% |
| Immigrants | Eastern Africa | 97.0 /100 | #89 | Exceptional 2.0% |
| Immigrants | Lebanon | 96.7 /100 | #90 | Exceptional 2.1% |
| Immigrants | Somalia | 96.2 /100 | #91 | Exceptional 2.1% |
| Immigrants | Syria | 96.2 /100 | #92 | Exceptional 2.1% |
| Immigrants | Europe | 96.1 /100 | #93 | Exceptional 2.1% |