Armenian vs Immigrants from Moldova Vision Disability
COMPARE
Armenian
Immigrants from Moldova
Vision Disability
Vision Disability Comparison
Armenians
Immigrants from Moldova
2.0%
VISION DISABILITY
99.0/ 100
METRIC RATING
63rd/ 347
METRIC RANK
2.0%
VISION DISABILITY
97.2/ 100
METRIC RATING
86th/ 347
METRIC RANK
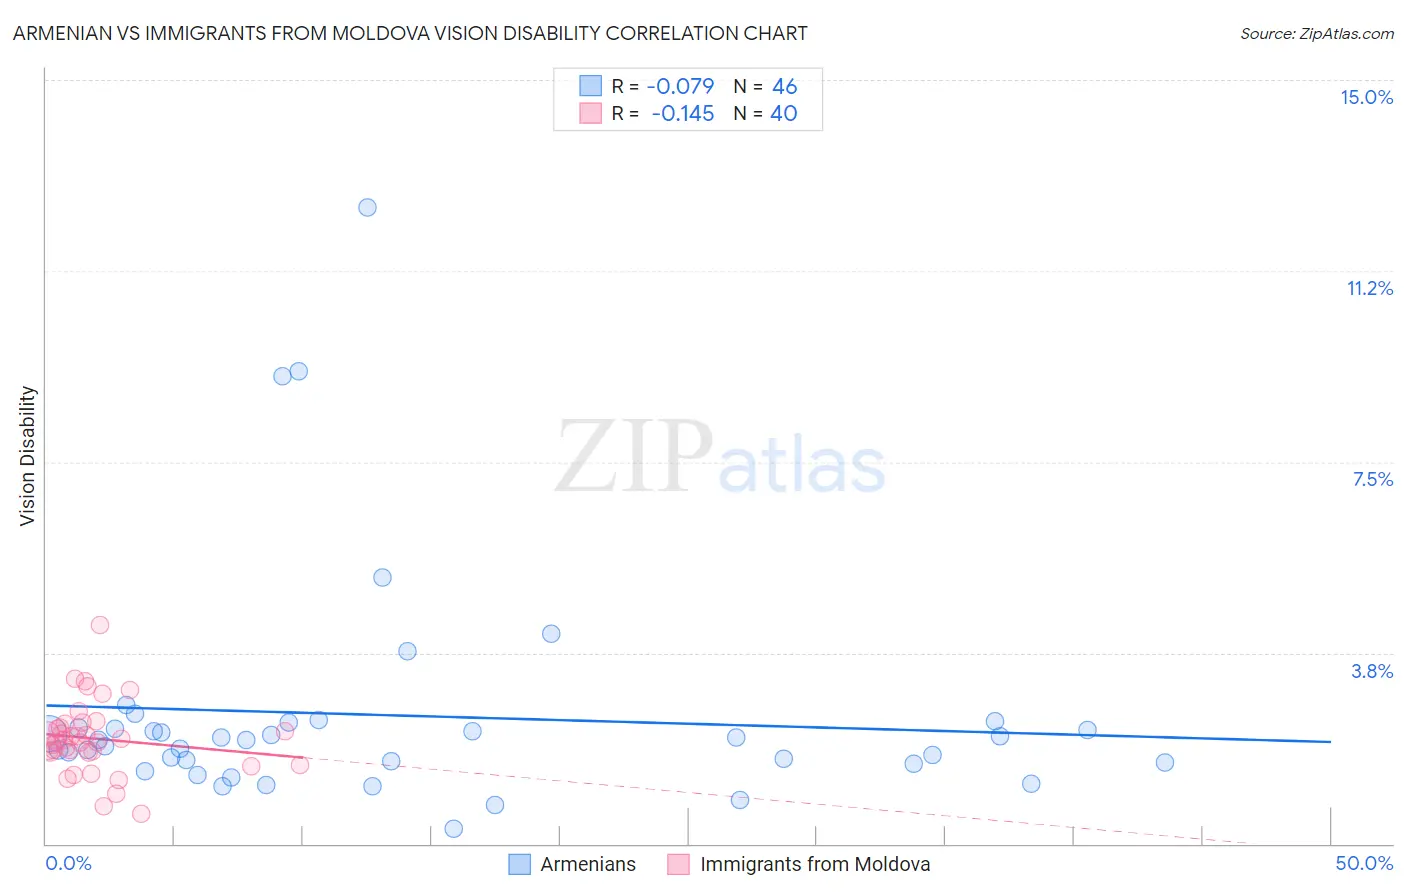
Armenian vs Immigrants from Moldova Vision Disability Correlation Chart
The statistical analysis conducted on geographies consisting of 310,763,377 people shows a slight negative correlation between the proportion of Armenians and percentage of population with vision disability in the United States with a correlation coefficient (R) of -0.079 and weighted average of 2.0%. Similarly, the statistical analysis conducted on geographies consisting of 124,355,490 people shows a poor negative correlation between the proportion of Immigrants from Moldova and percentage of population with vision disability in the United States with a correlation coefficient (R) of -0.145 and weighted average of 2.0%, a difference of 1.9%.
Vision Disability Correlation Summary
| Measurement | Armenian | Immigrants from Moldova |
| Minimum | 0.29% | 0.59% |
| Maximum | 12.5% | 4.3% |
| Range | 12.2% | 3.7% |
| Mean | 2.5% | 2.1% |
| Median | 2.0% | 2.0% |
| Interquartile 25% (IQ1) | 1.6% | 1.8% |
| Interquartile 75% (IQ3) | 2.3% | 2.3% |
| Interquartile Range (IQR) | 0.68% | 0.53% |
| Standard Deviation (Sample) | 2.3% | 0.71% |
| Standard Deviation (Population) | 2.3% | 0.70% |
Similar Demographics by Vision Disability
Demographics Similar to Armenians by Vision Disability
In terms of vision disability, the demographic groups most similar to Armenians are Immigrants from Russia (2.0%, a difference of 0.11%), Immigrants from Belgium (2.0%, a difference of 0.13%), Immigrants from Greece (2.0%, a difference of 0.13%), Immigrants from Romania (2.0%, a difference of 0.15%), and Argentinean (2.0%, a difference of 0.17%).
| Demographics | Rating | Rank | Vision Disability |
| Jordanians | 99.2 /100 | #56 | Exceptional 2.0% |
| Somalis | 99.2 /100 | #57 | Exceptional 2.0% |
| Immigrants | Saudi Arabia | 99.2 /100 | #58 | Exceptional 2.0% |
| Argentineans | 99.1 /100 | #59 | Exceptional 2.0% |
| Immigrants | Romania | 99.1 /100 | #60 | Exceptional 2.0% |
| Immigrants | Belgium | 99.1 /100 | #61 | Exceptional 2.0% |
| Immigrants | Russia | 99.1 /100 | #62 | Exceptional 2.0% |
| Armenians | 99.0 /100 | #63 | Exceptional 2.0% |
| Immigrants | Greece | 99.0 /100 | #64 | Exceptional 2.0% |
| Maltese | 98.9 /100 | #65 | Exceptional 2.0% |
| Immigrants | Argentina | 98.9 /100 | #66 | Exceptional 2.0% |
| Immigrants | Northern Africa | 98.8 /100 | #67 | Exceptional 2.0% |
| Immigrants | Czechoslovakia | 98.7 /100 | #68 | Exceptional 2.0% |
| Russians | 98.6 /100 | #69 | Exceptional 2.0% |
| Immigrants | Kazakhstan | 98.6 /100 | #70 | Exceptional 2.0% |
Demographics Similar to Immigrants from Moldova by Vision Disability
In terms of vision disability, the demographic groups most similar to Immigrants from Moldova are Chinese (2.0%, a difference of 0.020%), Immigrants from Switzerland (2.0%, a difference of 0.060%), Norwegian (2.0%, a difference of 0.070%), Immigrants from Latvia (2.0%, a difference of 0.080%), and Immigrants from Eastern Africa (2.0%, a difference of 0.11%).
| Demographics | Rating | Rank | Vision Disability |
| Assyrians/Chaldeans/Syriacs | 98.1 /100 | #79 | Exceptional 2.0% |
| Lithuanians | 97.7 /100 | #80 | Exceptional 2.0% |
| Soviet Union | 97.6 /100 | #81 | Exceptional 2.0% |
| Immigrants | Poland | 97.6 /100 | #82 | Exceptional 2.0% |
| Immigrants | Western Asia | 97.5 /100 | #83 | Exceptional 2.0% |
| Immigrants | Latvia | 97.3 /100 | #84 | Exceptional 2.0% |
| Chinese | 97.2 /100 | #85 | Exceptional 2.0% |
| Immigrants | Moldova | 97.2 /100 | #86 | Exceptional 2.0% |
| Immigrants | Switzerland | 97.0 /100 | #87 | Exceptional 2.0% |
| Norwegians | 97.0 /100 | #88 | Exceptional 2.0% |
| Immigrants | Eastern Africa | 97.0 /100 | #89 | Exceptional 2.0% |
| Immigrants | Lebanon | 96.7 /100 | #90 | Exceptional 2.1% |
| Immigrants | Somalia | 96.2 /100 | #91 | Exceptional 2.1% |
| Immigrants | Syria | 96.2 /100 | #92 | Exceptional 2.1% |
| Immigrants | Europe | 96.1 /100 | #93 | Exceptional 2.1% |