Swedish vs Immigrants from Ethiopia Vision Disability
COMPARE
Swedish
Immigrants from Ethiopia
Vision Disability
Vision Disability Comparison
Swedes
Immigrants from Ethiopia
2.1%
VISION DISABILITY
94.2/ 100
METRIC RATING
106th/ 347
METRIC RANK
2.0%
VISION DISABILITY
99.7/ 100
METRIC RATING
42nd/ 347
METRIC RANK
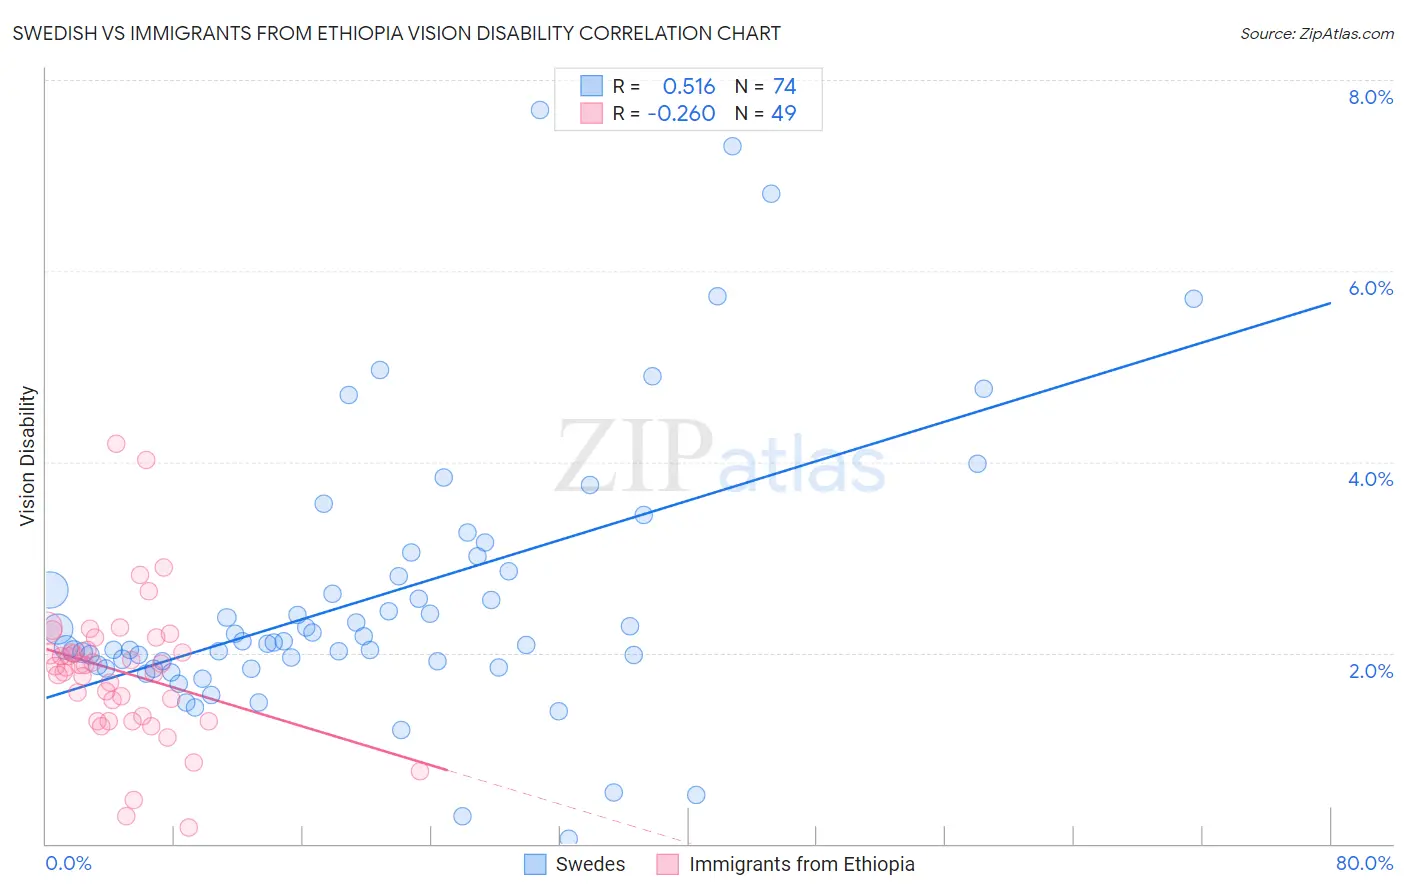
Swedish vs Immigrants from Ethiopia Vision Disability Correlation Chart
The statistical analysis conducted on geographies consisting of 537,778,731 people shows a substantial positive correlation between the proportion of Swedes and percentage of population with vision disability in the United States with a correlation coefficient (R) of 0.516 and weighted average of 2.1%. Similarly, the statistical analysis conducted on geographies consisting of 211,444,224 people shows a weak negative correlation between the proportion of Immigrants from Ethiopia and percentage of population with vision disability in the United States with a correlation coefficient (R) of -0.260 and weighted average of 2.0%, a difference of 5.2%.
Vision Disability Correlation Summary
| Measurement | Swedish | Immigrants from Ethiopia |
| Minimum | 0.053% | 0.17% |
| Maximum | 7.7% | 4.2% |
| Range | 7.6% | 4.0% |
| Mean | 2.6% | 1.8% |
| Median | 2.1% | 1.9% |
| Interquartile 25% (IQ1) | 1.9% | 1.3% |
| Interquartile 75% (IQ3) | 2.9% | 2.1% |
| Interquartile Range (IQR) | 0.99% | 0.79% |
| Standard Deviation (Sample) | 1.5% | 0.74% |
| Standard Deviation (Population) | 1.4% | 0.74% |
Similar Demographics by Vision Disability
Demographics Similar to Swedes by Vision Disability
In terms of vision disability, the demographic groups most similar to Swedes are Danish (2.1%, a difference of 0.010%), Korean (2.1%, a difference of 0.030%), Carpatho Rusyn (2.1%, a difference of 0.040%), Chilean (2.1%, a difference of 0.050%), and Immigrants from Italy (2.1%, a difference of 0.060%).
| Demographics | Rating | Rank | Vision Disability |
| Estonians | 95.3 /100 | #99 | Exceptional 2.1% |
| Greeks | 95.1 /100 | #100 | Exceptional 2.1% |
| Albanians | 94.9 /100 | #101 | Exceptional 2.1% |
| Sri Lankans | 94.8 /100 | #102 | Exceptional 2.1% |
| Immigrants | Austria | 94.4 /100 | #103 | Exceptional 2.1% |
| Immigrants | Italy | 94.4 /100 | #104 | Exceptional 2.1% |
| Carpatho Rusyns | 94.3 /100 | #105 | Exceptional 2.1% |
| Swedes | 94.2 /100 | #106 | Exceptional 2.1% |
| Danes | 94.2 /100 | #107 | Exceptional 2.1% |
| Koreans | 94.1 /100 | #108 | Exceptional 2.1% |
| Chileans | 94.0 /100 | #109 | Exceptional 2.1% |
| Immigrants | Armenia | 93.8 /100 | #110 | Exceptional 2.1% |
| Peruvians | 93.5 /100 | #111 | Exceptional 2.1% |
| Immigrants | Denmark | 92.9 /100 | #112 | Exceptional 2.1% |
| Kenyans | 92.5 /100 | #113 | Exceptional 2.1% |
Demographics Similar to Immigrants from Ethiopia by Vision Disability
In terms of vision disability, the demographic groups most similar to Immigrants from Ethiopia are Eastern European (2.0%, a difference of 0.060%), Immigrants from Indonesia (2.0%, a difference of 0.090%), Ethiopian (2.0%, a difference of 0.11%), Immigrants from Sweden (2.0%, a difference of 0.15%), and Cypriot (2.0%, a difference of 0.16%).
| Demographics | Rating | Rank | Vision Disability |
| Immigrants | Australia | 99.8 /100 | #35 | Exceptional 1.9% |
| Cambodians | 99.8 /100 | #36 | Exceptional 2.0% |
| Bhutanese | 99.8 /100 | #37 | Exceptional 2.0% |
| Immigrants | Kuwait | 99.8 /100 | #38 | Exceptional 2.0% |
| Zimbabweans | 99.7 /100 | #39 | Exceptional 2.0% |
| Immigrants | Ireland | 99.7 /100 | #40 | Exceptional 2.0% |
| Cypriots | 99.7 /100 | #41 | Exceptional 2.0% |
| Immigrants | Ethiopia | 99.7 /100 | #42 | Exceptional 2.0% |
| Eastern Europeans | 99.7 /100 | #43 | Exceptional 2.0% |
| Immigrants | Indonesia | 99.7 /100 | #44 | Exceptional 2.0% |
| Ethiopians | 99.7 /100 | #45 | Exceptional 2.0% |
| Immigrants | Sweden | 99.7 /100 | #46 | Exceptional 2.0% |
| Immigrants | Bulgaria | 99.7 /100 | #47 | Exceptional 2.0% |
| Israelis | 99.6 /100 | #48 | Exceptional 2.0% |
| Latvians | 99.5 /100 | #49 | Exceptional 2.0% |