Swedish vs Hawaiian Householder Income Ages 45 - 64 years

COMPARE

Swedish
Race
Ancestry
AfghanAfricanAlaska NativeAlaskan AthabascanAlbanianAleutAlsatianAmericanApacheArabArapahoArgentineanArmenianAssyrian/Chaldean/SyriacAustralianAustrianBahamianBangladeshiBarbadianBasqueBelgianBelizeanBermudanBhutaneseBlackfeetBolivianBrazilianBritishBritish West IndianBulgarianBurmeseCajunCambodianCanadianCape VerdeanCarpatho RusynCelticCentral AmericanCentral American IndianCherokeeCheyenneChickasawChileanChineseChippewaChoctawColombianColvilleComancheCosta RicanCreeCreekCroatianCrowCubanCypriotCzechCzechoslovakianDanishDelawareDominicanDutchDutch West IndianEastern EuropeanEcuadorianEgyptianEnglishEstonianEthiopianEuropeanFijianFilipinoFinnishFrenchFrench American IndianFrench CanadianGermanGerman RussianGhanaianGreekGuamanian/ChamorroGuatemalanGuyaneseHaitianHmongHonduranHopiHoumaHungarianIcelanderIndian (Asian)IndonesianInupiatIranianIraqiIrishIroquoisIsraeliItalianJamaicanJapaneseJordanianKenyanKiowaKoreanLaotianLatvianLebaneseLiberianLithuanianLumbeeLuxembourgerMacedonianMalaysianMalteseMarshalleseMenomineeMexicanMexican American IndianMongolianMoroccanNative HawaiianNavajoNepaleseNew ZealanderNicaraguanNigerianNorthern EuropeanNorwegianOkinawanOsageOttawaPaiutePakistaniPalestinianPanamanianParaguayanPennsylvania GermanPeruvianPimaPolishPortuguesePotawatomiPuebloPuerto RicanPuget Sound SalishRomanianRussianSalvadoranSamoanScandinavianScotch-IrishScottishSeminoleSenegaleseSerbianShoshoneSierra LeoneanSiouxSlavicSlovakSloveneSomaliSouth AfricanSouth AmericanSouth American IndianSoviet UnionSpaniardSpanishSpanish AmericanSpanish American IndianSri LankanSubsaharan AfricanSudaneseSwedishSwissSyrianTaiwaneseThaiTlingit-HaidaTohono O'OdhamTonganTrinidadian and TobagonianTsimshianTurkishU.S. Virgin IslanderUgandanUkrainianUruguayanUteVenezuelanVietnameseWelshWest IndianYakamaYaquiYugoslavianYumanYup'ikZimbabwean
Immigration
NonimmigrantsImmigrantsAfghanistanAfricaAlbaniaArgentinaArmeniaAsiaAustraliaAustriaBahamasBangladeshBarbadosBelarusBelgiumBelizeBoliviaBosnia and HerzegovinaBrazilBulgariaBurma/MyanmarCabo VerdeCambodiaCameroonCanadaCaribbeanCentral AmericaChileChinaColombiaCongoCosta RicaCroatiaCubaCzechoslovakiaDenmarkDominicaDominican RepublicEastern AfricaEastern AsiaEastern EuropeEcuadorEgyptEl SalvadorEnglandEritreaEthiopiaEuropeFijiFranceGermanyGhanaGreeceGrenadaGuatemalaGuyanaHaitiHondurasHong KongHungaryIndiaIndonesiaIranIraqIrelandIsraelItalyJamaicaJapanJordanKazakhstanKenyaKoreaKuwaitLaosLatin AmericaLatviaLebanonLiberiaLithuaniaMalaysiaMexicoMicronesiaMiddle AfricaMoldovaMoroccoNepalNetherlandsNicaraguaNigeriaNorth AmericaNorth MacedoniaNorthern AfricaNorthern EuropeNorwayOceaniaPakistanPanamaPeruPhilippinesPolandPortugalRomaniaRussiaSaudi ArabiaScotlandSenegalSerbiaSierra LeoneSingaporeSomaliaSouth AfricaSouth AmericaSouth Central AsiaSouth Eastern AsiaSouthern EuropeSpainSri LankaSt. Vincent and the GrenadinesSudanSwedenSwitzerlandSyriaTaiwanThailandTrinidad and TobagoTurkeyUgandaUkraineUruguayUzbekistanVenezuelaVietnamWest IndiesWestern AfricaWestern AsiaWestern EuropeYemenZaireZimbabweAzores
Hawaiian
Race
Ancestry
AfghanAfricanAlaska NativeAlaskan AthabascanAlbanianAleutAlsatianAmericanApacheArabArapahoArgentineanArmenianAssyrian/Chaldean/SyriacAustralianAustrianBahamianBangladeshiBarbadianBasqueBelgianBelizeanBermudanBhutaneseBlackfeetBolivianBrazilianBritishBritish West IndianBulgarianBurmeseCajunCambodianCanadianCape VerdeanCarpatho RusynCelticCentral AmericanCentral American IndianCherokeeCheyenneChickasawChileanChineseChippewaChoctawColombianColvilleComancheCosta RicanCreeCreekCroatianCrowCubanCypriotCzechCzechoslovakianDanishDelawareDominicanDutchDutch West IndianEastern EuropeanEcuadorianEgyptianEnglishEstonianEthiopianEuropeanFijianFilipinoFinnishFrenchFrench American IndianFrench CanadianGermanGerman RussianGhanaianGreekGuamanian/ChamorroGuatemalanGuyaneseHaitianHmongHonduranHopiHoumaHungarianIcelanderIndian (Asian)IndonesianInupiatIranianIraqiIrishIroquoisIsraeliItalianJamaicanJapaneseJordanianKenyanKiowaKoreanLaotianLatvianLebaneseLiberianLithuanianLumbeeLuxembourgerMacedonianMalaysianMalteseMarshalleseMenomineeMexicanMexican American IndianMongolianMoroccanNative HawaiianNavajoNepaleseNew ZealanderNicaraguanNigerianNorthern EuropeanNorwegianOkinawanOsageOttawaPaiutePakistaniPalestinianPanamanianParaguayanPennsylvania GermanPeruvianPimaPolishPortuguesePotawatomiPuebloPuerto RicanPuget Sound SalishRomanianRussianSalvadoranSamoanScandinavianScotch-IrishScottishSeminoleSenegaleseSerbianShoshoneSierra LeoneanSiouxSlavicSlovakSloveneSomaliSouth AfricanSouth AmericanSouth American IndianSoviet UnionSpaniardSpanishSpanish AmericanSpanish American IndianSri LankanSubsaharan AfricanSudaneseSwissSyrianTaiwaneseThaiTlingit-HaidaTohono O'OdhamTonganTrinidadian and TobagonianTsimshianTurkishU.S. Virgin IslanderUgandanUkrainianUruguayanUteVenezuelanVietnameseWelshWest IndianYakamaYaquiYugoslavianYumanYup'ikZimbabwean
Immigration
NonimmigrantsImmigrantsAfghanistanAfricaAlbaniaArgentinaArmeniaAsiaAustraliaAustriaBahamasBangladeshBarbadosBelarusBelgiumBelizeBoliviaBosnia and HerzegovinaBrazilBulgariaBurma/MyanmarCabo VerdeCambodiaCameroonCanadaCaribbeanCentral AmericaChileChinaColombiaCongoCosta RicaCroatiaCubaCzechoslovakiaDenmarkDominicaDominican RepublicEastern AfricaEastern AsiaEastern EuropeEcuadorEgyptEl SalvadorEnglandEritreaEthiopiaEuropeFijiFranceGermanyGhanaGreeceGrenadaGuatemalaGuyanaHaitiHondurasHong KongHungaryIndiaIndonesiaIranIraqIrelandIsraelItalyJamaicaJapanJordanKazakhstanKenyaKoreaKuwaitLaosLatin AmericaLatviaLebanonLiberiaLithuaniaMalaysiaMexicoMicronesiaMiddle AfricaMoldovaMoroccoNepalNetherlandsNicaraguaNigeriaNorth AmericaNorth MacedoniaNorthern AfricaNorthern EuropeNorwayOceaniaPakistanPanamaPeruPhilippinesPolandPortugalRomaniaRussiaSaudi ArabiaScotlandSenegalSerbiaSierra LeoneSingaporeSomaliaSouth AfricaSouth AmericaSouth Central AsiaSouth Eastern AsiaSouthern EuropeSpainSri LankaSt. Vincent and the GrenadinesSudanSwedenSwitzerlandSyriaTaiwanThailandTrinidad and TobagoTurkeyUgandaUkraineUruguayUzbekistanVenezuelaVietnamWest IndiesWestern AfricaWestern AsiaWestern EuropeYemenZaireZimbabweAzores
Householder Income Ages 45 - 64 years
Income
Poverty
Unemployment
Labor Participation
Family Structure
Vehicle Availability
Education Level
Disability

Householder Income Ages 45 - 64 years Comparison

Swedes

Hawaiians

Exceptional
Fair
$106,377
HOUSEHOLDER INCOME AGES 45 - 64 YEARS
95.4/ 100
METRIC RATING
112th/ 347
METRIC RANK
$98,778
HOUSEHOLDER INCOME AGES 45 - 64 YEARS
31.6/ 100
METRIC RATING
193rd/ 347
METRIC RANK

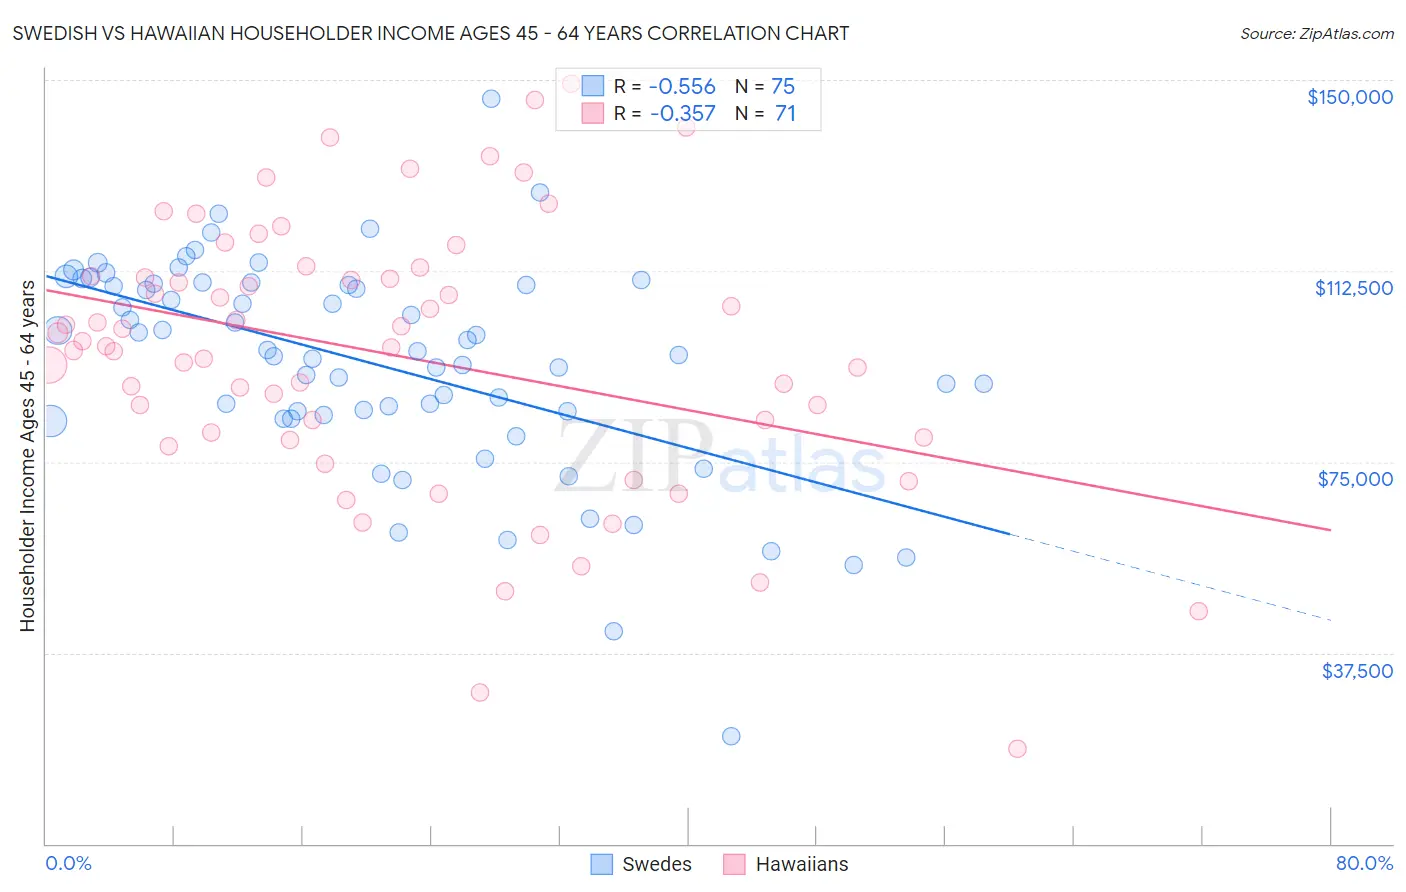
Swedish vs Hawaiian Householder Income Ages 45 - 64 years Correlation Chart

The statistical analysis conducted on geographies consisting of 536,739,042 people shows a substantial negative correlation between the proportion of Swedes and household income with householder between the ages 45 and 64 in the United States with a correlation coefficient (R) of -0.556 and weighted average of $106,377. Similarly, the statistical analysis conducted on geographies consisting of 327,005,411 people shows a mild negative correlation between the proportion of Hawaiians and household income with householder between the ages 45 and 64 in the United States with a correlation coefficient (R) of -0.357 and weighted average of $98,778, a difference of 7.7%.
Swedish vs Hawaiian Householder Income Ages 45 - 64 years

Householder Income Ages 45 - 64 years Correlation Summary

MeasurementSwedishHawaiian
Minimum$21,055$18,640
Maximum$146,263$149,180
Range$125,208$130,540
Mean$94,232$96,039
Median$96,778$97,593
Interquartile 25% (IQ1)$84,274$79,762
Interquartile 75% (IQ3)$109,981$111,438
Interquartile Range (IQR)$25,707$31,676
Standard Deviation (Sample)$21,129$26,677
Standard Deviation (Population)$20,987$26,488

Similar Demographics by Householder Income Ages 45 - 64 years

Demographics Similar to Swedes by Householder Income Ages 45 - 64 years

In terms of householder income ages 45 - 64 years, the demographic groups most similar to Swedes are European ($106,367, a difference of 0.010%), Immigrants from Vietnam ($106,417, a difference of 0.040%), Immigrants from Poland ($106,319, a difference of 0.060%), Immigrants from Brazil ($106,470, a difference of 0.090%), and Immigrants from Kuwait ($106,285, a difference of 0.090%).
DemographicsRating | RankHouseholder Income Ages 45 - 64 years
Macedonians
96.7
/100
|
#105
Exceptional
$107,074
Armenians
96.6
/100
|
#106
Exceptional
$107,002
Immigrants | Fiji
96.5
/100
|
#107
Exceptional
$106,952
Zimbabweans
96.3
/100
|
#108
Exceptional
$106,849
Chileans
95.9
/100
|
#109
Exceptional
$106,611
Immigrants | Brazil
95.6
/100
|
#110
Exceptional
$106,470
Immigrants | Vietnam
95.5
/100
|
#111
Exceptional
$106,417
Swedes
95.4
/100
|
#112
Exceptional
$106,377
Europeans
95.4
/100
|
#113
Exceptional
$106,367
Immigrants | Poland
95.3
/100
|
#114
Exceptional
$106,319
Immigrants | Kuwait
95.2
/100
|
#115
Exceptional
$106,285
British
95.2
/100
|
#116
Exceptional
$106,264
Albanians
95.1
/100
|
#117
Exceptional
$106,243
Immigrants | Western Asia
95.0
/100
|
#118
Exceptional
$106,217
Immigrants | Jordan
94.9
/100
|
#119
Exceptional
$106,164

Demographics Similar to Hawaiians by Householder Income Ages 45 - 64 years

In terms of householder income ages 45 - 64 years, the demographic groups most similar to Hawaiians are Celtic ($98,896, a difference of 0.12%), Uruguayan ($98,660, a difference of 0.12%), Kenyan ($98,970, a difference of 0.19%), Spanish ($98,554, a difference of 0.23%), and French Canadian ($99,093, a difference of 0.32%).
DemographicsRating | RankHouseholder Income Ages 45 - 64 years
Dutch
41.7
/100
|
#186
Average
$99,650
Iraqis
38.5
/100
|
#187
Fair
$99,387
Immigrants | Portugal
36.3
/100
|
#188
Fair
$99,203
Immigrants | South America
35.4
/100
|
#189
Fair
$99,126
French Canadians
35.1
/100
|
#190
Fair
$99,093
Kenyans
33.7
/100
|
#191
Fair
$98,970
Celtics
32.9
/100
|
#192
Fair
$98,896
Hawaiians
31.6
/100
|
#193
Fair
$98,778
Uruguayans
30.3
/100
|
#194
Fair
$98,660
Spanish
29.2
/100
|
#195
Fair
$98,554
Immigrants | Eastern Africa
28.3
/100
|
#196
Fair
$98,467
Puget Sound Salish
27.0
/100
|
#197
Fair
$98,340
Immigrants | Iraq
25.7
/100
|
#198
Fair
$98,201
Whites/Caucasians
24.6
/100
|
#199
Fair
$98,091
Immigrants | Kenya
23.5
/100
|
#200
Fair
$97,964