Immigrants from Kenya vs Hawaiian Disability Age Under 5
COMPARE
Immigrants from Kenya
Hawaiian
Disability Age Under 5
Disability Age Under 5 Comparison
Immigrants from Kenya
Hawaiians
1.2%
DISABILITY AGE UNDER 5
48.6/ 100
METRIC RATING
176th/ 347
METRIC RANK
1.2%
DISABILITY AGE UNDER 5
68.5/ 100
METRIC RATING
156th/ 347
METRIC RANK
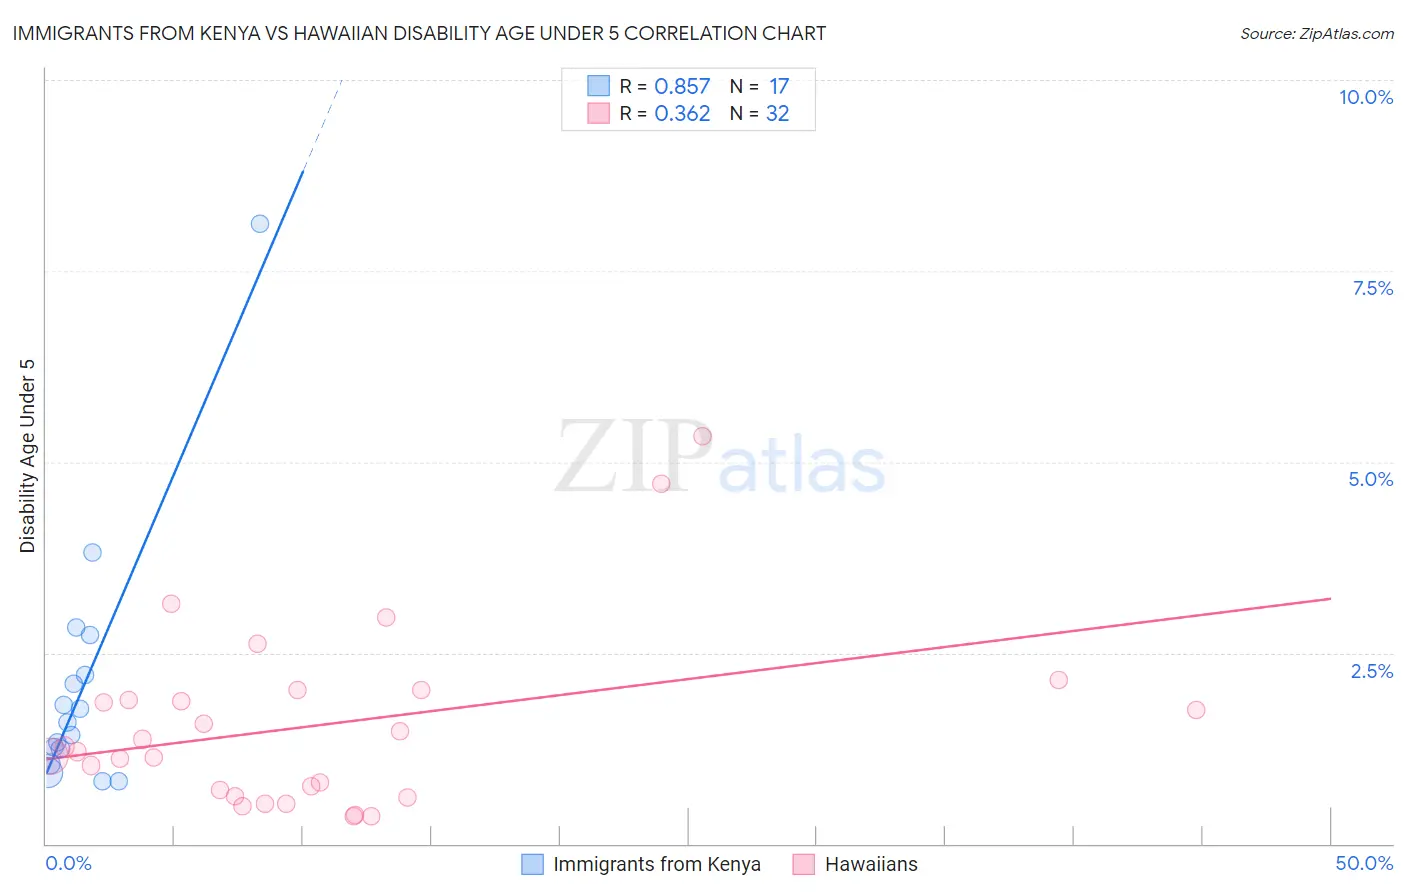
Immigrants from Kenya vs Hawaiian Disability Age Under 5 Correlation Chart
The statistical analysis conducted on geographies consisting of 142,514,351 people shows a very strong positive correlation between the proportion of Immigrants from Kenya and percentage of population with a disability under the age of 5 in the United States with a correlation coefficient (R) of 0.857 and weighted average of 1.2%. Similarly, the statistical analysis conducted on geographies consisting of 194,372,876 people shows a mild positive correlation between the proportion of Hawaiians and percentage of population with a disability under the age of 5 in the United States with a correlation coefficient (R) of 0.362 and weighted average of 1.2%, a difference of 1.9%.
Disability Age Under 5 Correlation Summary
| Measurement | Immigrants from Kenya | Hawaiian |
| Minimum | 0.82% | 0.35% |
| Maximum | 8.1% | 5.3% |
| Range | 7.3% | 5.0% |
| Mean | 2.1% | 1.6% |
| Median | 1.6% | 1.2% |
| Interquartile 25% (IQ1) | 1.1% | 0.66% |
| Interquartile 75% (IQ3) | 2.5% | 1.9% |
| Interquartile Range (IQR) | 1.3% | 1.3% |
| Standard Deviation (Sample) | 1.7% | 1.2% |
| Standard Deviation (Population) | 1.7% | 1.2% |
Demographics Similar to Immigrants from Kenya and Hawaiians by Disability Age Under 5
In terms of disability age under 5, the demographic groups most similar to Immigrants from Kenya are Immigrants from Latvia (1.2%, a difference of 0.13%), Immigrants from Nigeria (1.2%, a difference of 0.13%), Immigrants from Ireland (1.2%, a difference of 0.15%), Crow (1.2%, a difference of 0.22%), and Guamanian/Chamorro (1.2%, a difference of 0.85%). Similarly, the demographic groups most similar to Hawaiians are Immigrants from South America (1.2%, a difference of 0.16%), Arab (1.2%, a difference of 0.22%), Colombian (1.2%, a difference of 0.28%), Immigrants from Latin America (1.2%, a difference of 0.28%), and Immigrants from Africa (1.2%, a difference of 0.35%).
| Demographics | Rating | Rank | Disability Age Under 5 |
| Hawaiians | 68.5 /100 | #156 | Good 1.2% |
| Immigrants | South America | 67.0 /100 | #157 | Good 1.2% |
| Arabs | 66.4 /100 | #158 | Good 1.2% |
| Colombians | 65.8 /100 | #159 | Good 1.2% |
| Immigrants | Latin America | 65.8 /100 | #160 | Good 1.2% |
| Immigrants | Africa | 65.1 /100 | #161 | Good 1.2% |
| Guatemalans | 63.6 /100 | #162 | Good 1.2% |
| Immigrants | Guatemala | 63.2 /100 | #163 | Good 1.2% |
| Laotians | 62.8 /100 | #164 | Good 1.2% |
| Immigrants | Kuwait | 62.6 /100 | #165 | Good 1.2% |
| Immigrants | Central America | 61.4 /100 | #166 | Good 1.2% |
| Immigrants | Argentina | 60.2 /100 | #167 | Good 1.2% |
| Sierra Leoneans | 59.1 /100 | #168 | Average 1.2% |
| Immigrants | Uruguay | 59.0 /100 | #169 | Average 1.2% |
| Immigrants | Jamaica | 58.8 /100 | #170 | Average 1.2% |
| Guamanians/Chamorros | 57.8 /100 | #171 | Average 1.2% |
| Crow | 51.0 /100 | #172 | Average 1.2% |
| Immigrants | Ireland | 50.3 /100 | #173 | Average 1.2% |
| Immigrants | Latvia | 50.0 /100 | #174 | Average 1.2% |
| Immigrants | Nigeria | 50.0 /100 | #175 | Average 1.2% |
| Immigrants | Kenya | 48.6 /100 | #176 | Average 1.2% |