Turkish vs Cypriot Disability
COMPARE
Turkish
Cypriot
Disability
Disability Comparison
Turks
Cypriots
10.7%
DISABILITY
100.0/ 100
METRIC RATING
37th/ 347
METRIC RANK
10.6%
DISABILITY
100.0/ 100
METRIC RATING
27th/ 347
METRIC RANK
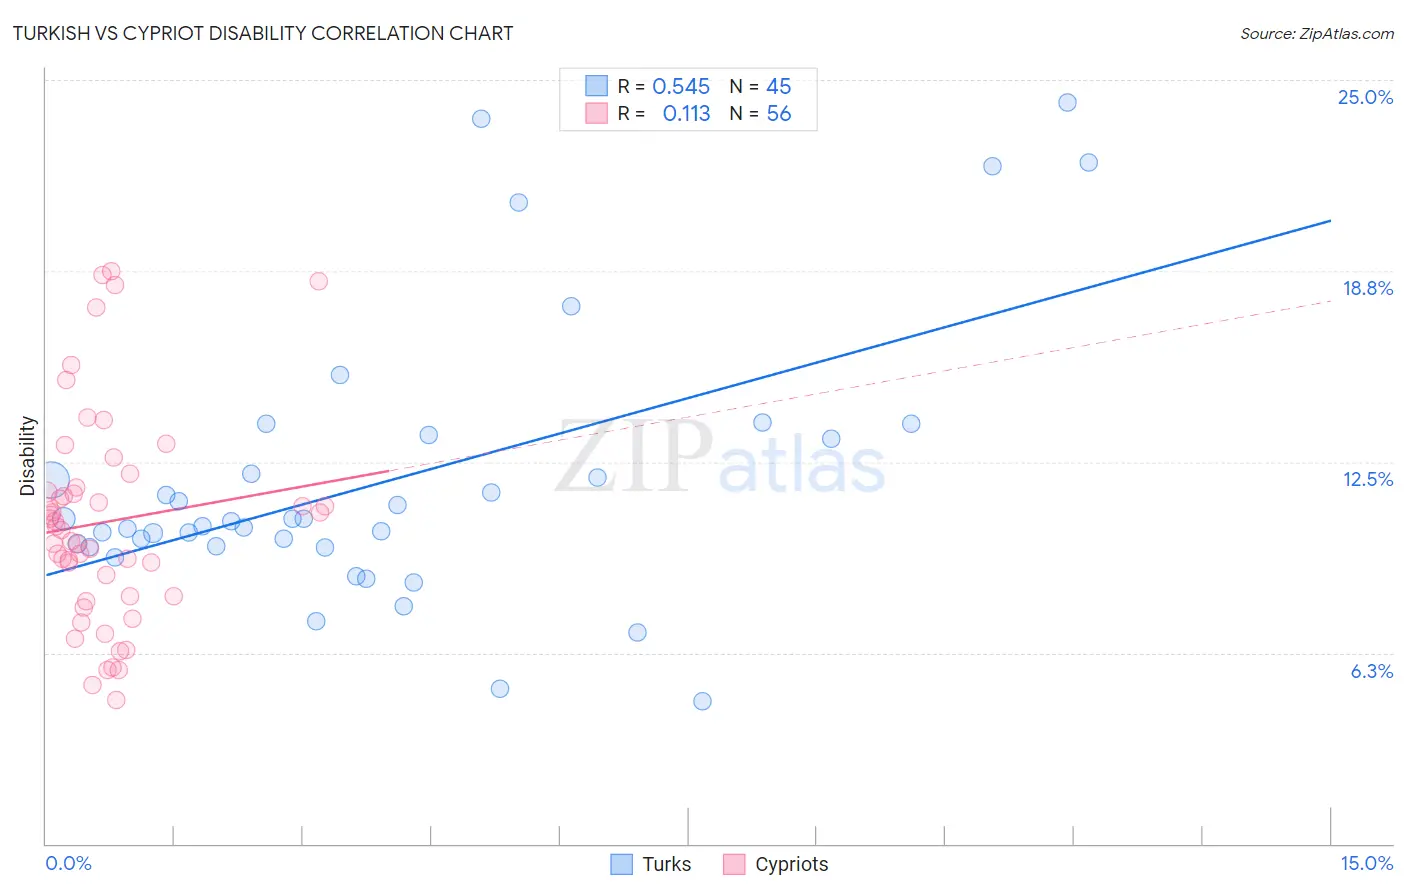
Turkish vs Cypriot Disability Correlation Chart
The statistical analysis conducted on geographies consisting of 271,857,414 people shows a substantial positive correlation between the proportion of Turks and percentage of population with a disability in the United States with a correlation coefficient (R) of 0.545 and weighted average of 10.7%. Similarly, the statistical analysis conducted on geographies consisting of 61,867,698 people shows a poor positive correlation between the proportion of Cypriots and percentage of population with a disability in the United States with a correlation coefficient (R) of 0.113 and weighted average of 10.6%, a difference of 1.1%.
Disability Correlation Summary
| Measurement | Turkish | Cypriot |
| Minimum | 4.7% | 4.7% |
| Maximum | 24.3% | 18.7% |
| Range | 19.6% | 14.0% |
| Mean | 11.9% | 10.5% |
| Median | 10.6% | 10.3% |
| Interquartile 25% (IQ1) | 9.7% | 8.1% |
| Interquartile 75% (IQ3) | 13.3% | 11.6% |
| Interquartile Range (IQR) | 3.6% | 3.5% |
| Standard Deviation (Sample) | 4.5% | 3.5% |
| Standard Deviation (Population) | 4.5% | 3.4% |
Demographics Similar to Turks and Cypriots by Disability
In terms of disability, the demographic groups most similar to Turks are Ethiopian (10.7%, a difference of 0.010%), Immigrants from Indonesia (10.7%, a difference of 0.070%), Immigrants from Ethiopia (10.7%, a difference of 0.080%), Immigrants from Kuwait (10.7%, a difference of 0.30%), and Afghan (10.8%, a difference of 0.44%). Similarly, the demographic groups most similar to Cypriots are Argentinean (10.6%, a difference of 0.010%), Immigrants from Malaysia (10.6%, a difference of 0.060%), Egyptian (10.6%, a difference of 0.13%), Immigrants from Argentina (10.6%, a difference of 0.26%), and Immigrants from Turkey (10.6%, a difference of 0.41%).
| Demographics | Rating | Rank | Disability |
| Immigrants | Sri Lanka | 100.0 /100 | #22 | Exceptional 10.5% |
| Immigrants | Asia | 100.0 /100 | #23 | Exceptional 10.5% |
| Venezuelans | 100.0 /100 | #24 | Exceptional 10.5% |
| Immigrants | Malaysia | 100.0 /100 | #25 | Exceptional 10.6% |
| Argentineans | 100.0 /100 | #26 | Exceptional 10.6% |
| Cypriots | 100.0 /100 | #27 | Exceptional 10.6% |
| Egyptians | 100.0 /100 | #28 | Exceptional 10.6% |
| Immigrants | Argentina | 100.0 /100 | #29 | Exceptional 10.6% |
| Immigrants | Turkey | 100.0 /100 | #30 | Exceptional 10.6% |
| Immigrants | Egypt | 100.0 /100 | #31 | Exceptional 10.6% |
| Paraguayans | 100.0 /100 | #32 | Exceptional 10.6% |
| Immigrants | Kuwait | 100.0 /100 | #33 | Exceptional 10.7% |
| Immigrants | Ethiopia | 100.0 /100 | #34 | Exceptional 10.7% |
| Immigrants | Indonesia | 100.0 /100 | #35 | Exceptional 10.7% |
| Ethiopians | 100.0 /100 | #36 | Exceptional 10.7% |
| Turks | 100.0 /100 | #37 | Exceptional 10.7% |
| Afghans | 99.9 /100 | #38 | Exceptional 10.8% |
| Cambodians | 99.9 /100 | #39 | Exceptional 10.8% |
| Mongolians | 99.9 /100 | #40 | Exceptional 10.8% |
| Immigrants | Australia | 99.9 /100 | #41 | Exceptional 10.8% |
| Immigrants | Nepal | 99.9 /100 | #42 | Exceptional 10.8% |