Immigrants from Western Africa vs Cypriot Disability
COMPARE
Immigrants from Western Africa
Cypriot
Disability
Disability Comparison
Immigrants from Western Africa
Cypriots
11.7%
DISABILITY
47.5/ 100
METRIC RATING
176th/ 347
METRIC RANK
10.6%
DISABILITY
100.0/ 100
METRIC RATING
27th/ 347
METRIC RANK
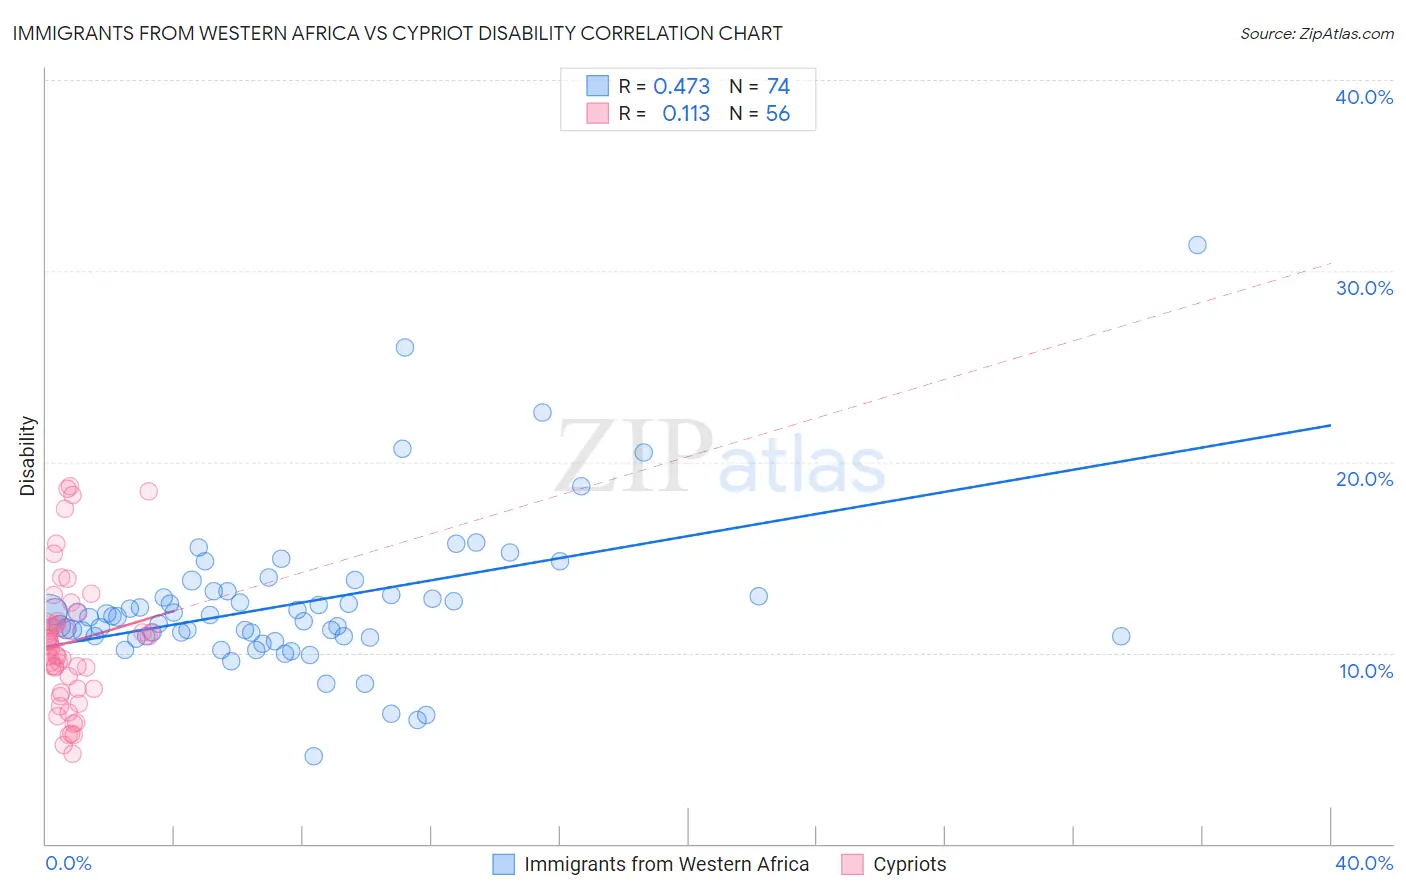
Immigrants from Western Africa vs Cypriot Disability Correlation Chart
The statistical analysis conducted on geographies consisting of 357,817,429 people shows a moderate positive correlation between the proportion of Immigrants from Western Africa and percentage of population with a disability in the United States with a correlation coefficient (R) of 0.473 and weighted average of 11.7%. Similarly, the statistical analysis conducted on geographies consisting of 61,867,698 people shows a poor positive correlation between the proportion of Cypriots and percentage of population with a disability in the United States with a correlation coefficient (R) of 0.113 and weighted average of 10.6%, a difference of 10.6%.
Disability Correlation Summary
| Measurement | Immigrants from Western Africa | Cypriot |
| Minimum | 4.6% | 4.7% |
| Maximum | 31.3% | 18.7% |
| Range | 26.7% | 14.0% |
| Mean | 12.6% | 10.5% |
| Median | 11.9% | 10.3% |
| Interquartile 25% (IQ1) | 10.9% | 8.1% |
| Interquartile 75% (IQ3) | 13.0% | 11.6% |
| Interquartile Range (IQR) | 2.2% | 3.5% |
| Standard Deviation (Sample) | 4.0% | 3.5% |
| Standard Deviation (Population) | 4.0% | 3.4% |
Similar Demographics by Disability
Demographics Similar to Immigrants from Western Africa by Disability
In terms of disability, the demographic groups most similar to Immigrants from Western Africa are Immigrants from Central America (11.7%, a difference of 0.040%), Haitian (11.7%, a difference of 0.050%), Greek (11.7%, a difference of 0.060%), Albanian (11.7%, a difference of 0.11%), and Maltese (11.7%, a difference of 0.14%).
| Demographics | Rating | Rank | Disability |
| Immigrants | Austria | 53.4 /100 | #169 | Average 11.7% |
| Immigrants | Albania | 52.8 /100 | #170 | Average 11.7% |
| Immigrants | Southern Europe | 52.8 /100 | #171 | Average 11.7% |
| Trinidadians and Tobagonians | 52.7 /100 | #172 | Average 11.7% |
| Maltese | 50.6 /100 | #173 | Average 11.7% |
| Albanians | 50.0 /100 | #174 | Average 11.7% |
| Haitians | 48.6 /100 | #175 | Average 11.7% |
| Immigrants | Western Africa | 47.5 /100 | #176 | Average 11.7% |
| Immigrants | Central America | 46.6 /100 | #177 | Average 11.7% |
| Greeks | 46.2 /100 | #178 | Average 11.7% |
| Immigrants | Armenia | 41.9 /100 | #179 | Average 11.7% |
| Immigrants | Honduras | 37.8 /100 | #180 | Fair 11.8% |
| Immigrants | Oceania | 34.3 /100 | #181 | Fair 11.8% |
| Icelanders | 34.0 /100 | #182 | Fair 11.8% |
| Hondurans | 31.2 /100 | #183 | Fair 11.8% |
Demographics Similar to Cypriots by Disability
In terms of disability, the demographic groups most similar to Cypriots are Argentinean (10.6%, a difference of 0.010%), Immigrants from Malaysia (10.6%, a difference of 0.060%), Egyptian (10.6%, a difference of 0.13%), Immigrants from Argentina (10.6%, a difference of 0.26%), and Immigrants from Turkey (10.6%, a difference of 0.41%).
| Demographics | Rating | Rank | Disability |
| Immigrants | Venezuela | 100.0 /100 | #20 | Exceptional 10.4% |
| Asians | 100.0 /100 | #21 | Exceptional 10.4% |
| Immigrants | Sri Lanka | 100.0 /100 | #22 | Exceptional 10.5% |
| Immigrants | Asia | 100.0 /100 | #23 | Exceptional 10.5% |
| Venezuelans | 100.0 /100 | #24 | Exceptional 10.5% |
| Immigrants | Malaysia | 100.0 /100 | #25 | Exceptional 10.6% |
| Argentineans | 100.0 /100 | #26 | Exceptional 10.6% |
| Cypriots | 100.0 /100 | #27 | Exceptional 10.6% |
| Egyptians | 100.0 /100 | #28 | Exceptional 10.6% |
| Immigrants | Argentina | 100.0 /100 | #29 | Exceptional 10.6% |
| Immigrants | Turkey | 100.0 /100 | #30 | Exceptional 10.6% |
| Immigrants | Egypt | 100.0 /100 | #31 | Exceptional 10.6% |
| Paraguayans | 100.0 /100 | #32 | Exceptional 10.6% |
| Immigrants | Kuwait | 100.0 /100 | #33 | Exceptional 10.7% |
| Immigrants | Ethiopia | 100.0 /100 | #34 | Exceptional 10.7% |