Sudanese vs Ottawa 2nd Grade
COMPARE
Sudanese
Ottawa
2nd Grade
2nd Grade Comparison
Sudanese
Ottawa
97.7%
2ND GRADE
5.7/ 100
METRIC RATING
218th/ 347
METRIC RANK
98.4%
2ND GRADE
99.9/ 100
METRIC RATING
47th/ 347
METRIC RANK
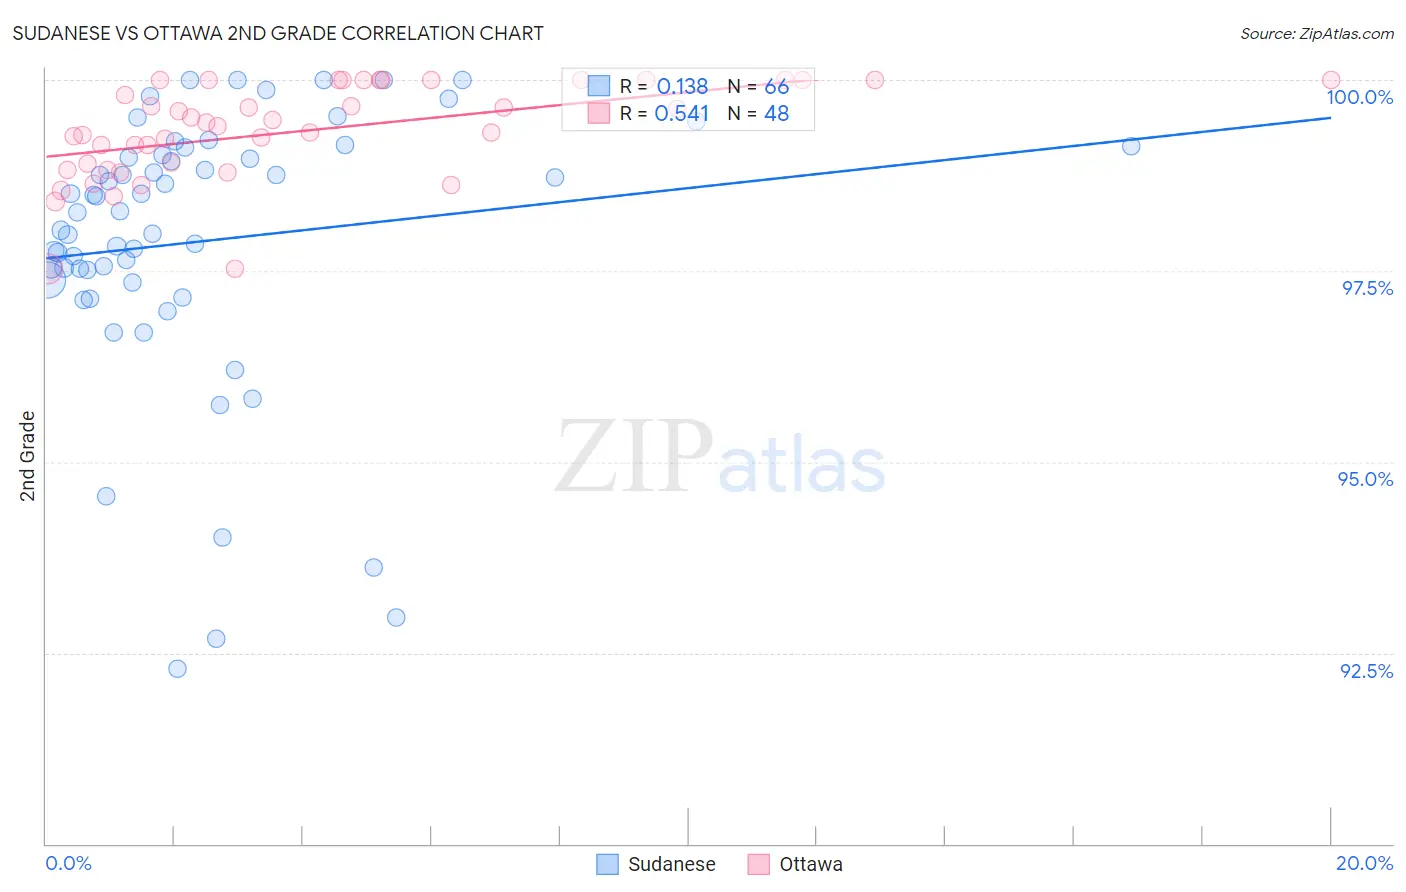
Sudanese vs Ottawa 2nd Grade Correlation Chart
The statistical analysis conducted on geographies consisting of 110,135,898 people shows a poor positive correlation between the proportion of Sudanese and percentage of population with at least 2nd grade education in the United States with a correlation coefficient (R) of 0.138 and weighted average of 97.7%. Similarly, the statistical analysis conducted on geographies consisting of 49,956,726 people shows a substantial positive correlation between the proportion of Ottawa and percentage of population with at least 2nd grade education in the United States with a correlation coefficient (R) of 0.541 and weighted average of 98.4%, a difference of 0.74%.
2nd Grade Correlation Summary
| Measurement | Sudanese | Ottawa |
| Minimum | 92.3% | 97.5% |
| Maximum | 100.0% | 100.0% |
| Range | 7.7% | 2.5% |
| Mean | 97.9% | 99.3% |
| Median | 98.3% | 99.4% |
| Interquartile 25% (IQ1) | 97.4% | 98.9% |
| Interquartile 75% (IQ3) | 99.0% | 100.0% |
| Interquartile Range (IQR) | 1.6% | 1.1% |
| Standard Deviation (Sample) | 1.8% | 0.63% |
| Standard Deviation (Population) | 1.8% | 0.63% |
Similar Demographics by 2nd Grade
Demographics Similar to Sudanese by 2nd Grade
In terms of 2nd grade, the demographic groups most similar to Sudanese are South American Indian (97.7%, a difference of 0.010%), Uruguayan (97.7%, a difference of 0.010%), Immigrants from Panama (97.6%, a difference of 0.010%), Immigrants from Morocco (97.6%, a difference of 0.010%), and Samoan (97.7%, a difference of 0.020%).
| Demographics | Rating | Rank | 2nd Grade |
| Laotians | 9.9 /100 | #211 | Tragic 97.7% |
| Immigrants | Bahamas | 8.4 /100 | #212 | Tragic 97.7% |
| Moroccans | 8.2 /100 | #213 | Tragic 97.7% |
| Samoans | 7.1 /100 | #214 | Tragic 97.7% |
| Bahamians | 6.8 /100 | #215 | Tragic 97.7% |
| South American Indians | 6.7 /100 | #216 | Tragic 97.7% |
| Uruguayans | 6.2 /100 | #217 | Tragic 97.7% |
| Sudanese | 5.7 /100 | #218 | Tragic 97.7% |
| Immigrants | Panama | 5.1 /100 | #219 | Tragic 97.6% |
| Immigrants | Morocco | 5.0 /100 | #220 | Tragic 97.6% |
| Iraqis | 4.6 /100 | #221 | Tragic 97.6% |
| Immigrants | Sudan | 4.5 /100 | #222 | Tragic 97.6% |
| Sierra Leoneans | 4.3 /100 | #223 | Tragic 97.6% |
| Immigrants | Zaire | 4.3 /100 | #224 | Tragic 97.6% |
| Tongans | 4.3 /100 | #225 | Tragic 97.6% |
Demographics Similar to Ottawa by 2nd Grade
In terms of 2nd grade, the demographic groups most similar to Ottawa are Czechoslovakian (98.4%, a difference of 0.0%), Hungarian (98.4%, a difference of 0.010%), Lumbee (98.4%, a difference of 0.010%), Celtic (98.4%, a difference of 0.020%), and White/Caucasian (98.4%, a difference of 0.020%).
| Demographics | Rating | Rank | 2nd Grade |
| Luxembourgers | 99.9 /100 | #40 | Exceptional 98.4% |
| Eastern Europeans | 99.9 /100 | #41 | Exceptional 98.4% |
| Native Hawaiians | 99.9 /100 | #42 | Exceptional 98.4% |
| Belgians | 99.9 /100 | #43 | Exceptional 98.4% |
| Northern Europeans | 99.9 /100 | #44 | Exceptional 98.4% |
| Hungarians | 99.9 /100 | #45 | Exceptional 98.4% |
| Lumbee | 99.9 /100 | #46 | Exceptional 98.4% |
| Ottawa | 99.9 /100 | #47 | Exceptional 98.4% |
| Czechoslovakians | 99.9 /100 | #48 | Exceptional 98.4% |
| Celtics | 99.8 /100 | #49 | Exceptional 98.4% |
| Whites/Caucasians | 99.8 /100 | #50 | Exceptional 98.4% |
| Estonians | 99.8 /100 | #51 | Exceptional 98.4% |
| Australians | 99.8 /100 | #52 | Exceptional 98.4% |
| Pueblo | 99.8 /100 | #53 | Exceptional 98.3% |
| Kiowa | 99.8 /100 | #54 | Exceptional 98.3% |