Immigrants from Grenada vs Ottawa Self-Care Disability
COMPARE
Immigrants from Grenada
Ottawa
Self-Care Disability
Self-Care Disability Comparison
Immigrants from Grenada
Ottawa
2.8%
SELF-CARE DISABILITY
0.0/ 100
METRIC RATING
308th/ 347
METRIC RANK
2.7%
SELF-CARE DISABILITY
0.1/ 100
METRIC RATING
278th/ 347
METRIC RANK
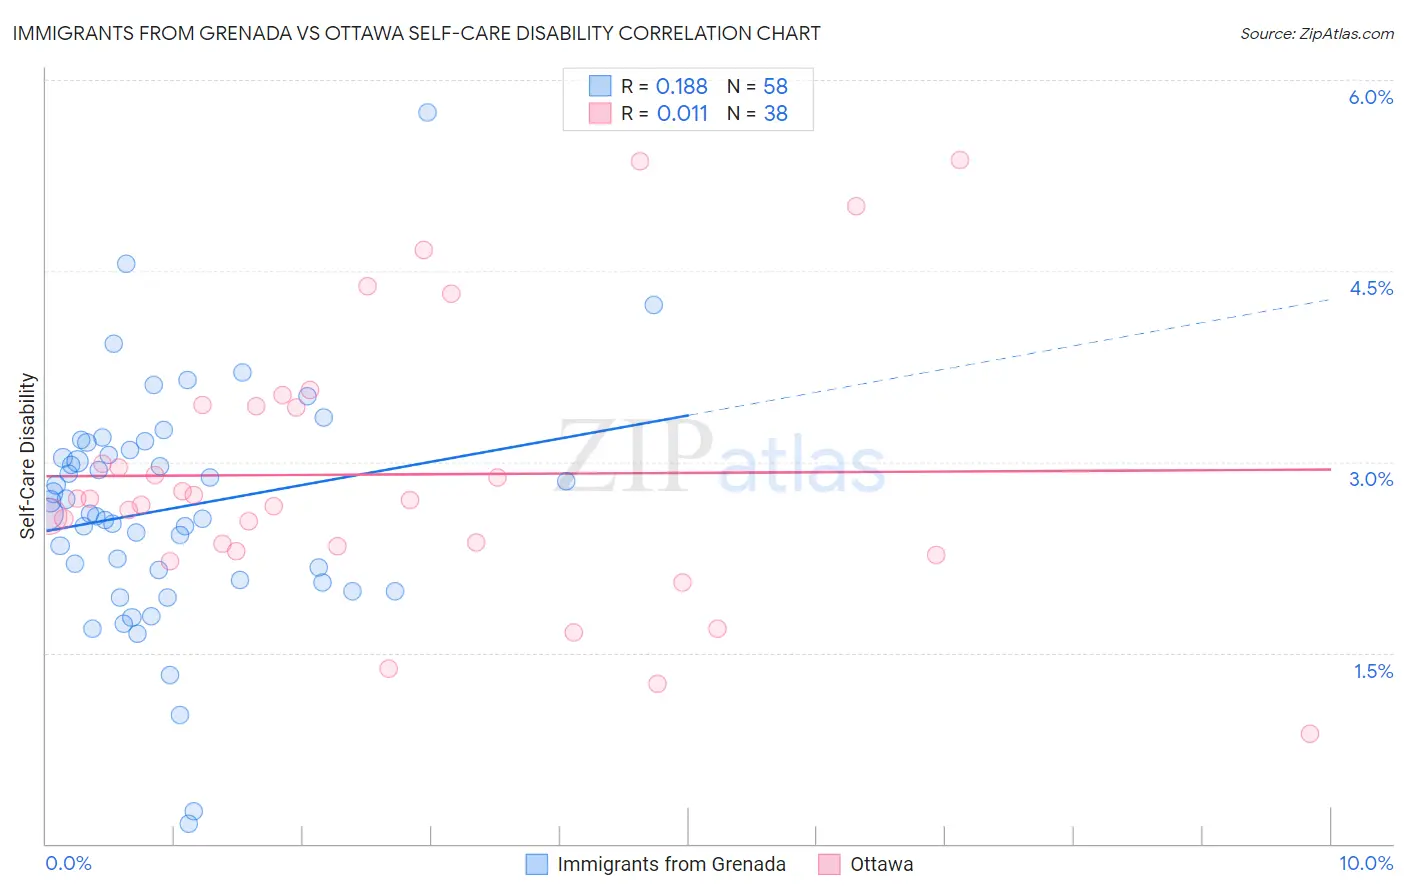
Immigrants from Grenada vs Ottawa Self-Care Disability Correlation Chart
The statistical analysis conducted on geographies consisting of 67,173,864 people shows a poor positive correlation between the proportion of Immigrants from Grenada and percentage of population with self-care disability in the United States with a correlation coefficient (R) of 0.188 and weighted average of 2.8%. Similarly, the statistical analysis conducted on geographies consisting of 49,939,429 people shows no correlation between the proportion of Ottawa and percentage of population with self-care disability in the United States with a correlation coefficient (R) of 0.011 and weighted average of 2.7%, a difference of 4.8%.
Self-Care Disability Correlation Summary
| Measurement | Immigrants from Grenada | Ottawa |
| Minimum | 0.16% | 0.86% |
| Maximum | 5.7% | 5.4% |
| Range | 5.6% | 4.5% |
| Mean | 2.6% | 2.9% |
| Median | 2.6% | 2.7% |
| Interquartile 25% (IQ1) | 2.1% | 2.3% |
| Interquartile 75% (IQ3) | 3.1% | 3.4% |
| Interquartile Range (IQR) | 1.0% | 1.1% |
| Standard Deviation (Sample) | 0.92% | 1.1% |
| Standard Deviation (Population) | 0.92% | 1.0% |
Similar Demographics by Self-Care Disability
Demographics Similar to Immigrants from Grenada by Self-Care Disability
In terms of self-care disability, the demographic groups most similar to Immigrants from Grenada are Bangladeshi (2.8%, a difference of 0.15%), British West Indian (2.8%, a difference of 0.25%), Native/Alaskan (2.8%, a difference of 0.30%), Puget Sound Salish (2.8%, a difference of 0.32%), and Aleut (2.8%, a difference of 0.37%).
| Demographics | Rating | Rank | Self-Care Disability |
| Pima | 0.0 /100 | #301 | Tragic 2.8% |
| Immigrants | St. Vincent and the Grenadines | 0.0 /100 | #302 | Tragic 2.8% |
| Immigrants | Belize | 0.0 /100 | #303 | Tragic 2.8% |
| Cree | 0.0 /100 | #304 | Tragic 2.8% |
| Immigrants | West Indies | 0.0 /100 | #305 | Tragic 2.8% |
| Aleuts | 0.0 /100 | #306 | Tragic 2.8% |
| Natives/Alaskans | 0.0 /100 | #307 | Tragic 2.8% |
| Immigrants | Grenada | 0.0 /100 | #308 | Tragic 2.8% |
| Bangladeshis | 0.0 /100 | #309 | Tragic 2.8% |
| British West Indians | 0.0 /100 | #310 | Tragic 2.8% |
| Puget Sound Salish | 0.0 /100 | #311 | Tragic 2.8% |
| Immigrants | Caribbean | 0.0 /100 | #312 | Tragic 2.8% |
| Spanish Americans | 0.0 /100 | #313 | Tragic 2.8% |
| Creek | 0.0 /100 | #314 | Tragic 2.8% |
| Immigrants | Cuba | 0.0 /100 | #315 | Tragic 2.8% |
Demographics Similar to Ottawa by Self-Care Disability
In terms of self-care disability, the demographic groups most similar to Ottawa are Immigrants from Ukraine (2.7%, a difference of 0.080%), Iroquois (2.7%, a difference of 0.10%), Hispanic or Latino (2.7%, a difference of 0.12%), Japanese (2.7%, a difference of 0.14%), and Yakama (2.7%, a difference of 0.27%).
| Demographics | Rating | Rank | Self-Care Disability |
| Trinidadians and Tobagonians | 0.1 /100 | #271 | Tragic 2.7% |
| Immigrants | Laos | 0.1 /100 | #272 | Tragic 2.7% |
| Mexicans | 0.1 /100 | #273 | Tragic 2.7% |
| Yakama | 0.1 /100 | #274 | Tragic 2.7% |
| Immigrants | Trinidad and Tobago | 0.1 /100 | #275 | Tragic 2.7% |
| Japanese | 0.1 /100 | #276 | Tragic 2.7% |
| Immigrants | Ukraine | 0.1 /100 | #277 | Tragic 2.7% |
| Ottawa | 0.1 /100 | #278 | Tragic 2.7% |
| Iroquois | 0.1 /100 | #279 | Tragic 2.7% |
| Hispanics or Latinos | 0.1 /100 | #280 | Tragic 2.7% |
| Immigrants | Iraq | 0.0 /100 | #281 | Tragic 2.7% |
| Apache | 0.0 /100 | #282 | Tragic 2.7% |
| Delaware | 0.0 /100 | #283 | Tragic 2.7% |
| Fijians | 0.0 /100 | #284 | Tragic 2.7% |
| Jamaicans | 0.0 /100 | #285 | Tragic 2.7% |