Immigrants from Brazil vs Immigrants from Liberia Vision Disability
COMPARE
Immigrants from Brazil
Immigrants from Liberia
Vision Disability
Vision Disability Comparison
Immigrants from Brazil
Immigrants from Liberia
2.2%
VISION DISABILITY
13.1/ 100
METRIC RATING
209th/ 347
METRIC RANK
2.4%
VISION DISABILITY
0.1/ 100
METRIC RATING
264th/ 347
METRIC RANK
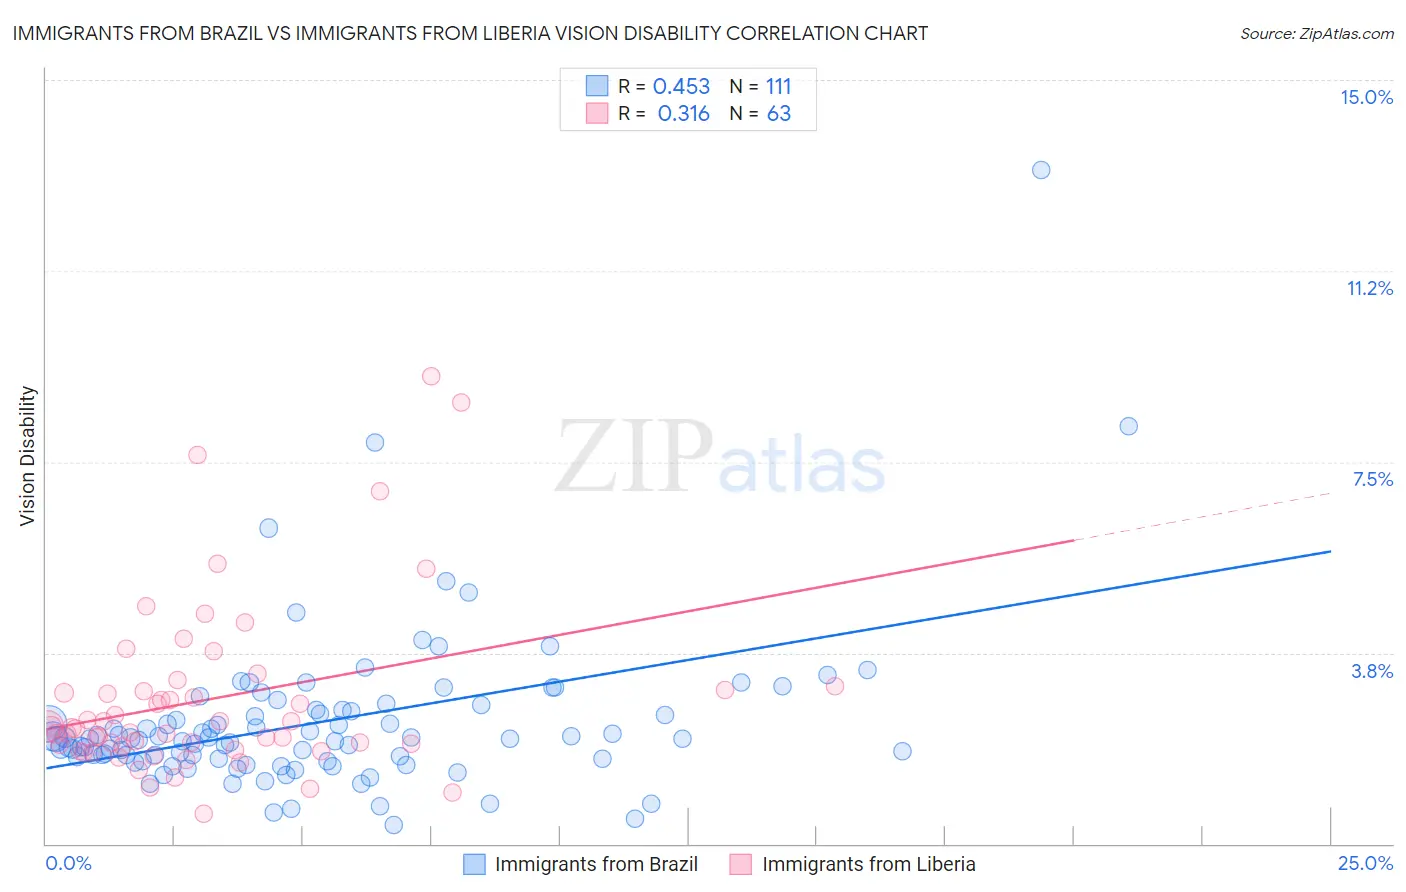
Immigrants from Brazil vs Immigrants from Liberia Vision Disability Correlation Chart
The statistical analysis conducted on geographies consisting of 342,850,216 people shows a moderate positive correlation between the proportion of Immigrants from Brazil and percentage of population with vision disability in the United States with a correlation coefficient (R) of 0.453 and weighted average of 2.2%. Similarly, the statistical analysis conducted on geographies consisting of 135,226,423 people shows a mild positive correlation between the proportion of Immigrants from Liberia and percentage of population with vision disability in the United States with a correlation coefficient (R) of 0.316 and weighted average of 2.4%, a difference of 7.5%.
Vision Disability Correlation Summary
| Measurement | Immigrants from Brazil | Immigrants from Liberia |
| Minimum | 0.36% | 0.59% |
| Maximum | 13.2% | 9.2% |
| Range | 12.9% | 8.6% |
| Mean | 2.4% | 2.8% |
| Median | 2.1% | 2.3% |
| Interquartile 25% (IQ1) | 1.7% | 1.9% |
| Interquartile 75% (IQ3) | 2.6% | 3.0% |
| Interquartile Range (IQR) | 0.94% | 1.1% |
| Standard Deviation (Sample) | 1.6% | 1.7% |
| Standard Deviation (Population) | 1.6% | 1.7% |
Similar Demographics by Vision Disability
Demographics Similar to Immigrants from Brazil by Vision Disability
In terms of vision disability, the demographic groups most similar to Immigrants from Brazil are Immigrants from Nigeria (2.2%, a difference of 0.040%), German (2.2%, a difference of 0.040%), Pennsylvania German (2.2%, a difference of 0.18%), Immigrants from Uruguay (2.2%, a difference of 0.23%), and Samoan (2.2%, a difference of 0.31%).
| Demographics | Rating | Rank | Vision Disability |
| Immigrants | Zaire | 18.0 /100 | #202 | Poor 2.2% |
| Dutch | 17.1 /100 | #203 | Poor 2.2% |
| Immigrants | Guyana | 15.9 /100 | #204 | Poor 2.2% |
| Samoans | 15.7 /100 | #205 | Poor 2.2% |
| Pennsylvania Germans | 14.5 /100 | #206 | Poor 2.2% |
| Immigrants | Nigeria | 13.5 /100 | #207 | Poor 2.2% |
| Germans | 13.4 /100 | #208 | Poor 2.2% |
| Immigrants | Brazil | 13.1 /100 | #209 | Poor 2.2% |
| Immigrants | Uruguay | 11.5 /100 | #210 | Poor 2.2% |
| Indonesians | 9.5 /100 | #211 | Tragic 2.2% |
| Bermudans | 9.0 /100 | #212 | Tragic 2.2% |
| Immigrants | Ghana | 8.9 /100 | #213 | Tragic 2.2% |
| Trinidadians and Tobagonians | 8.2 /100 | #214 | Tragic 2.2% |
| Nigerians | 7.2 /100 | #215 | Tragic 2.3% |
| Immigrants | Trinidad and Tobago | 6.1 /100 | #216 | Tragic 2.3% |
Demographics Similar to Immigrants from Liberia by Vision Disability
In terms of vision disability, the demographic groups most similar to Immigrants from Liberia are Immigrants from Jamaica (2.4%, a difference of 0.020%), Mexican American Indian (2.4%, a difference of 0.070%), Ute (2.4%, a difference of 0.080%), Immigrants from Belize (2.4%, a difference of 0.12%), and Senegalese (2.4%, a difference of 0.16%).
| Demographics | Rating | Rank | Vision Disability |
| West Indians | 0.2 /100 | #257 | Tragic 2.4% |
| British West Indians | 0.2 /100 | #258 | Tragic 2.4% |
| Whites/Caucasians | 0.2 /100 | #259 | Tragic 2.4% |
| Belizeans | 0.2 /100 | #260 | Tragic 2.4% |
| Fijians | 0.1 /100 | #261 | Tragic 2.4% |
| Jamaicans | 0.1 /100 | #262 | Tragic 2.4% |
| Immigrants | Belize | 0.1 /100 | #263 | Tragic 2.4% |
| Immigrants | Liberia | 0.1 /100 | #264 | Tragic 2.4% |
| Immigrants | Jamaica | 0.1 /100 | #265 | Tragic 2.4% |
| Mexican American Indians | 0.1 /100 | #266 | Tragic 2.4% |
| Ute | 0.1 /100 | #267 | Tragic 2.4% |
| Senegalese | 0.1 /100 | #268 | Tragic 2.4% |
| Celtics | 0.1 /100 | #269 | Tragic 2.4% |
| Cubans | 0.1 /100 | #270 | Tragic 2.4% |
| Immigrants | Azores | 0.1 /100 | #271 | Tragic 2.4% |