Immigrants from Northern Africa vs Immigrants from Liberia Vision Disability
COMPARE
Immigrants from Northern Africa
Immigrants from Liberia
Vision Disability
Vision Disability Comparison
Immigrants from Northern Africa
Immigrants from Liberia
2.0%
VISION DISABILITY
98.8/ 100
METRIC RATING
67th/ 347
METRIC RANK
2.4%
VISION DISABILITY
0.1/ 100
METRIC RATING
264th/ 347
METRIC RANK
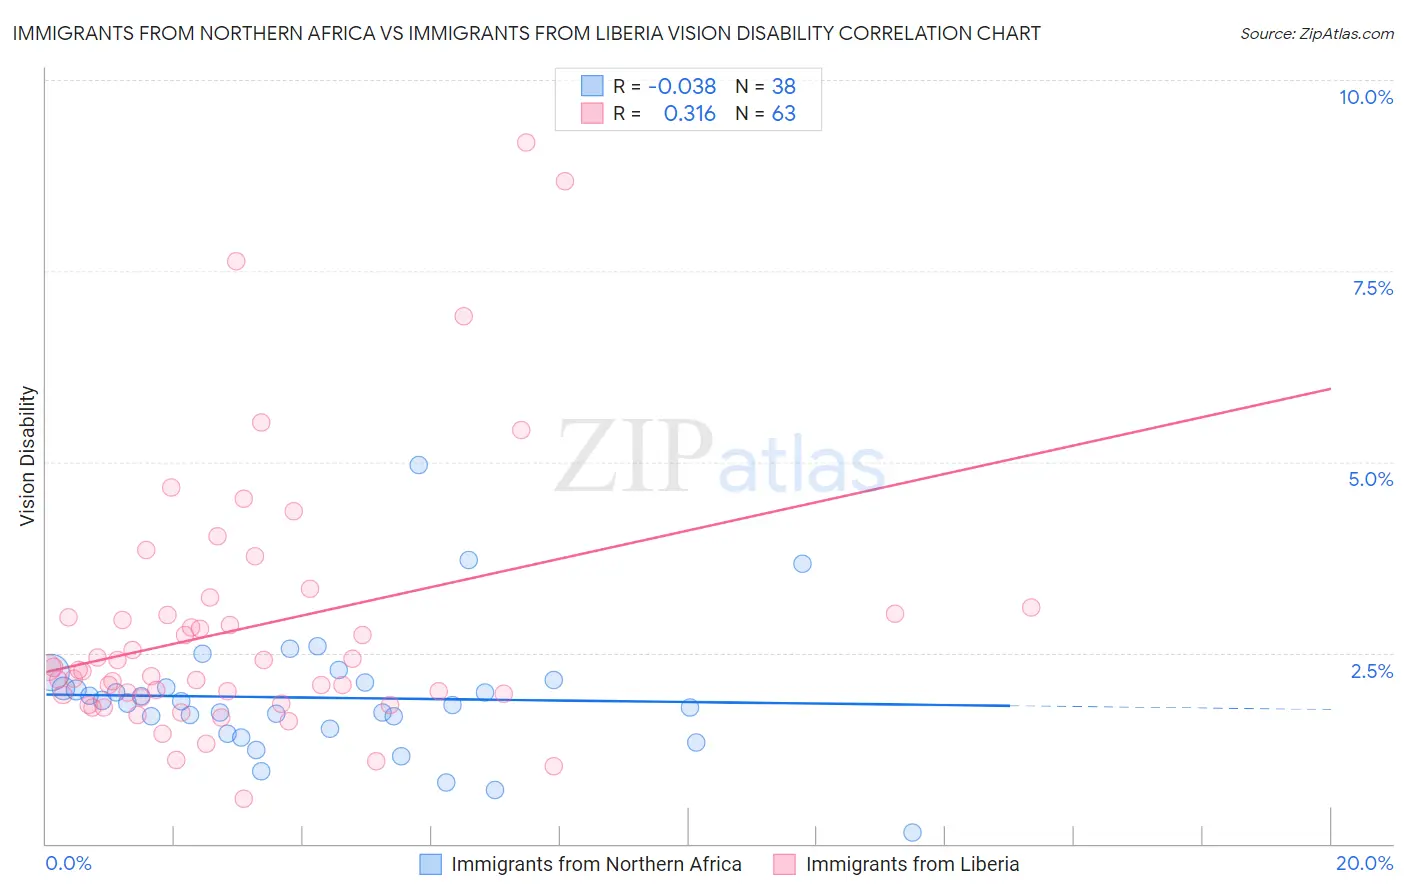
Immigrants from Northern Africa vs Immigrants from Liberia Vision Disability Correlation Chart
The statistical analysis conducted on geographies consisting of 321,057,261 people shows no correlation between the proportion of Immigrants from Northern Africa and percentage of population with vision disability in the United States with a correlation coefficient (R) of -0.038 and weighted average of 2.0%. Similarly, the statistical analysis conducted on geographies consisting of 135,226,423 people shows a mild positive correlation between the proportion of Immigrants from Liberia and percentage of population with vision disability in the United States with a correlation coefficient (R) of 0.316 and weighted average of 2.4%, a difference of 19.0%.
Vision Disability Correlation Summary
| Measurement | Immigrants from Northern Africa | Immigrants from Liberia |
| Minimum | 0.14% | 0.59% |
| Maximum | 5.0% | 9.2% |
| Range | 4.8% | 8.6% |
| Mean | 1.9% | 2.8% |
| Median | 1.9% | 2.3% |
| Interquartile 25% (IQ1) | 1.5% | 1.9% |
| Interquartile 75% (IQ3) | 2.1% | 3.0% |
| Interquartile Range (IQR) | 0.61% | 1.1% |
| Standard Deviation (Sample) | 0.84% | 1.7% |
| Standard Deviation (Population) | 0.83% | 1.7% |
Similar Demographics by Vision Disability
Demographics Similar to Immigrants from Northern Africa by Vision Disability
In terms of vision disability, the demographic groups most similar to Immigrants from Northern Africa are Immigrants from Czechoslovakia (2.0%, a difference of 0.10%), Immigrants from Argentina (2.0%, a difference of 0.11%), Maltese (2.0%, a difference of 0.17%), Immigrants from Greece (2.0%, a difference of 0.24%), and Russian (2.0%, a difference of 0.27%).
| Demographics | Rating | Rank | Vision Disability |
| Immigrants | Romania | 99.1 /100 | #60 | Exceptional 2.0% |
| Immigrants | Belgium | 99.1 /100 | #61 | Exceptional 2.0% |
| Immigrants | Russia | 99.1 /100 | #62 | Exceptional 2.0% |
| Armenians | 99.0 /100 | #63 | Exceptional 2.0% |
| Immigrants | Greece | 99.0 /100 | #64 | Exceptional 2.0% |
| Maltese | 98.9 /100 | #65 | Exceptional 2.0% |
| Immigrants | Argentina | 98.9 /100 | #66 | Exceptional 2.0% |
| Immigrants | Northern Africa | 98.8 /100 | #67 | Exceptional 2.0% |
| Immigrants | Czechoslovakia | 98.7 /100 | #68 | Exceptional 2.0% |
| Russians | 98.6 /100 | #69 | Exceptional 2.0% |
| Immigrants | Kazakhstan | 98.6 /100 | #70 | Exceptional 2.0% |
| Immigrants | Northern Europe | 98.6 /100 | #71 | Exceptional 2.0% |
| Immigrants | France | 98.5 /100 | #72 | Exceptional 2.0% |
| Immigrants | Eritrea | 98.4 /100 | #73 | Exceptional 2.0% |
| Palestinians | 98.3 /100 | #74 | Exceptional 2.0% |
Demographics Similar to Immigrants from Liberia by Vision Disability
In terms of vision disability, the demographic groups most similar to Immigrants from Liberia are Immigrants from Jamaica (2.4%, a difference of 0.020%), Mexican American Indian (2.4%, a difference of 0.070%), Ute (2.4%, a difference of 0.080%), Immigrants from Belize (2.4%, a difference of 0.12%), and Senegalese (2.4%, a difference of 0.16%).
| Demographics | Rating | Rank | Vision Disability |
| West Indians | 0.2 /100 | #257 | Tragic 2.4% |
| British West Indians | 0.2 /100 | #258 | Tragic 2.4% |
| Whites/Caucasians | 0.2 /100 | #259 | Tragic 2.4% |
| Belizeans | 0.2 /100 | #260 | Tragic 2.4% |
| Fijians | 0.1 /100 | #261 | Tragic 2.4% |
| Jamaicans | 0.1 /100 | #262 | Tragic 2.4% |
| Immigrants | Belize | 0.1 /100 | #263 | Tragic 2.4% |
| Immigrants | Liberia | 0.1 /100 | #264 | Tragic 2.4% |
| Immigrants | Jamaica | 0.1 /100 | #265 | Tragic 2.4% |
| Mexican American Indians | 0.1 /100 | #266 | Tragic 2.4% |
| Ute | 0.1 /100 | #267 | Tragic 2.4% |
| Senegalese | 0.1 /100 | #268 | Tragic 2.4% |
| Celtics | 0.1 /100 | #269 | Tragic 2.4% |
| Cubans | 0.1 /100 | #270 | Tragic 2.4% |
| Immigrants | Azores | 0.1 /100 | #271 | Tragic 2.4% |