Maltese vs Immigrants from Liberia Vision Disability
COMPARE
Maltese
Immigrants from Liberia
Vision Disability
Vision Disability Comparison
Maltese
Immigrants from Liberia
2.0%
VISION DISABILITY
98.9/ 100
METRIC RATING
65th/ 347
METRIC RANK
2.4%
VISION DISABILITY
0.1/ 100
METRIC RATING
264th/ 347
METRIC RANK
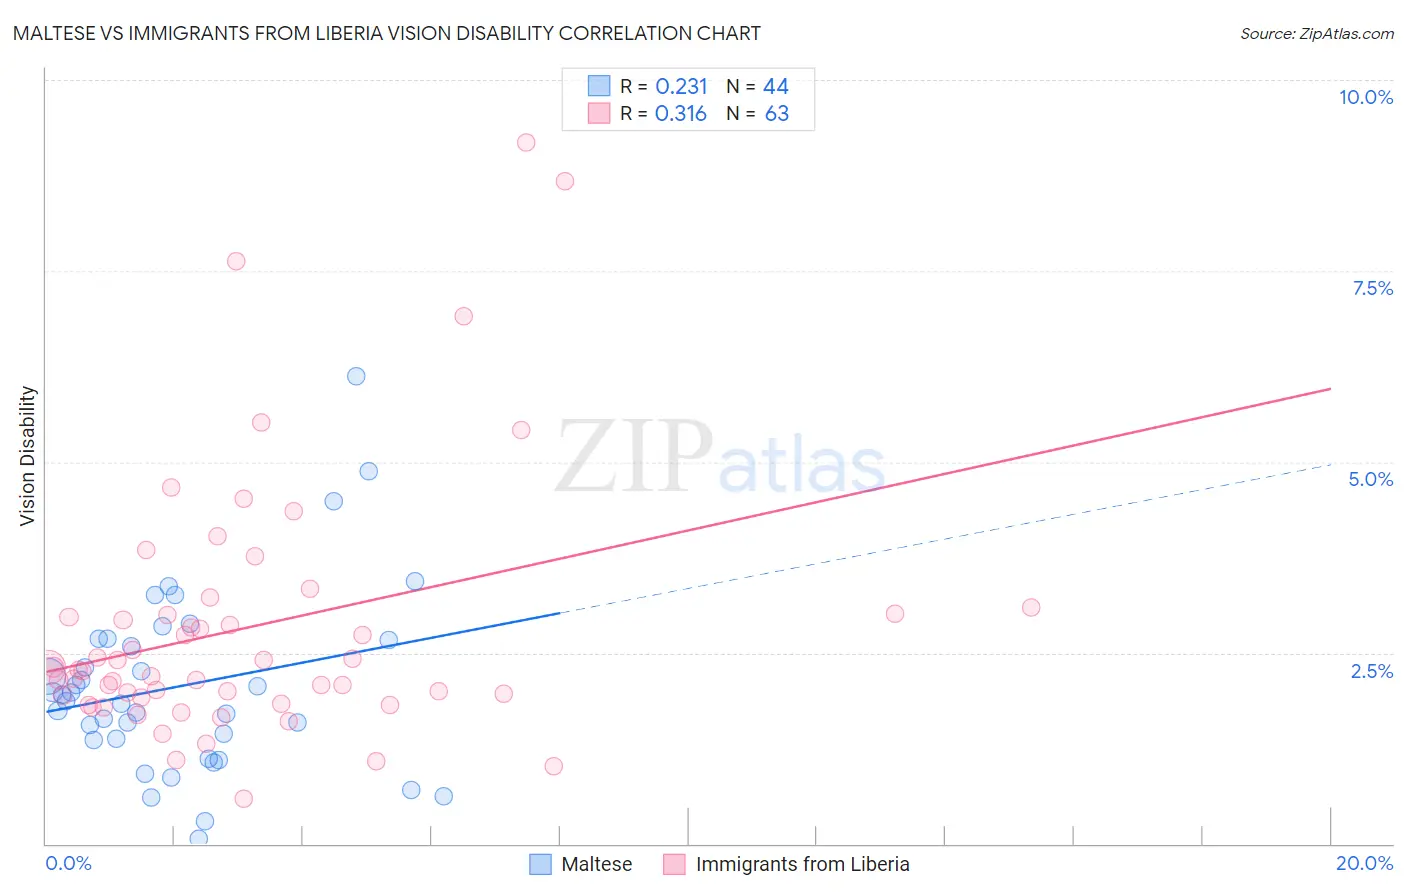
Maltese vs Immigrants from Liberia Vision Disability Correlation Chart
The statistical analysis conducted on geographies consisting of 126,445,167 people shows a weak positive correlation between the proportion of Maltese and percentage of population with vision disability in the United States with a correlation coefficient (R) of 0.231 and weighted average of 2.0%. Similarly, the statistical analysis conducted on geographies consisting of 135,226,423 people shows a mild positive correlation between the proportion of Immigrants from Liberia and percentage of population with vision disability in the United States with a correlation coefficient (R) of 0.316 and weighted average of 2.4%, a difference of 19.2%.
Vision Disability Correlation Summary
| Measurement | Maltese | Immigrants from Liberia |
| Minimum | 0.070% | 0.59% |
| Maximum | 6.1% | 9.2% |
| Range | 6.0% | 8.6% |
| Mean | 2.1% | 2.8% |
| Median | 1.9% | 2.3% |
| Interquartile 25% (IQ1) | 1.4% | 1.9% |
| Interquartile 75% (IQ3) | 2.7% | 3.0% |
| Interquartile Range (IQR) | 1.3% | 1.1% |
| Standard Deviation (Sample) | 1.2% | 1.7% |
| Standard Deviation (Population) | 1.2% | 1.7% |
Similar Demographics by Vision Disability
Demographics Similar to Maltese by Vision Disability
In terms of vision disability, the demographic groups most similar to Maltese are Immigrants from Argentina (2.0%, a difference of 0.060%), Immigrants from Greece (2.0%, a difference of 0.070%), Immigrants from Northern Africa (2.0%, a difference of 0.17%), Armenian (2.0%, a difference of 0.20%), and Immigrants from Czechoslovakia (2.0%, a difference of 0.27%).
| Demographics | Rating | Rank | Vision Disability |
| Immigrants | Saudi Arabia | 99.2 /100 | #58 | Exceptional 2.0% |
| Argentineans | 99.1 /100 | #59 | Exceptional 2.0% |
| Immigrants | Romania | 99.1 /100 | #60 | Exceptional 2.0% |
| Immigrants | Belgium | 99.1 /100 | #61 | Exceptional 2.0% |
| Immigrants | Russia | 99.1 /100 | #62 | Exceptional 2.0% |
| Armenians | 99.0 /100 | #63 | Exceptional 2.0% |
| Immigrants | Greece | 99.0 /100 | #64 | Exceptional 2.0% |
| Maltese | 98.9 /100 | #65 | Exceptional 2.0% |
| Immigrants | Argentina | 98.9 /100 | #66 | Exceptional 2.0% |
| Immigrants | Northern Africa | 98.8 /100 | #67 | Exceptional 2.0% |
| Immigrants | Czechoslovakia | 98.7 /100 | #68 | Exceptional 2.0% |
| Russians | 98.6 /100 | #69 | Exceptional 2.0% |
| Immigrants | Kazakhstan | 98.6 /100 | #70 | Exceptional 2.0% |
| Immigrants | Northern Europe | 98.6 /100 | #71 | Exceptional 2.0% |
| Immigrants | France | 98.5 /100 | #72 | Exceptional 2.0% |
Demographics Similar to Immigrants from Liberia by Vision Disability
In terms of vision disability, the demographic groups most similar to Immigrants from Liberia are Immigrants from Jamaica (2.4%, a difference of 0.020%), Mexican American Indian (2.4%, a difference of 0.070%), Ute (2.4%, a difference of 0.080%), Immigrants from Belize (2.4%, a difference of 0.12%), and Senegalese (2.4%, a difference of 0.16%).
| Demographics | Rating | Rank | Vision Disability |
| West Indians | 0.2 /100 | #257 | Tragic 2.4% |
| British West Indians | 0.2 /100 | #258 | Tragic 2.4% |
| Whites/Caucasians | 0.2 /100 | #259 | Tragic 2.4% |
| Belizeans | 0.2 /100 | #260 | Tragic 2.4% |
| Fijians | 0.1 /100 | #261 | Tragic 2.4% |
| Jamaicans | 0.1 /100 | #262 | Tragic 2.4% |
| Immigrants | Belize | 0.1 /100 | #263 | Tragic 2.4% |
| Immigrants | Liberia | 0.1 /100 | #264 | Tragic 2.4% |
| Immigrants | Jamaica | 0.1 /100 | #265 | Tragic 2.4% |
| Mexican American Indians | 0.1 /100 | #266 | Tragic 2.4% |
| Ute | 0.1 /100 | #267 | Tragic 2.4% |
| Senegalese | 0.1 /100 | #268 | Tragic 2.4% |
| Celtics | 0.1 /100 | #269 | Tragic 2.4% |
| Cubans | 0.1 /100 | #270 | Tragic 2.4% |
| Immigrants | Azores | 0.1 /100 | #271 | Tragic 2.4% |