Sudanese vs Immigrants from Eritrea Hearing Disability
COMPARE
Sudanese
Immigrants from Eritrea
Hearing Disability
Hearing Disability Comparison
Sudanese
Immigrants from Eritrea
2.9%
HEARING DISABILITY
72.1/ 100
METRIC RATING
153rd/ 347
METRIC RANK
2.7%
HEARING DISABILITY
98.5/ 100
METRIC RATING
59th/ 347
METRIC RANK
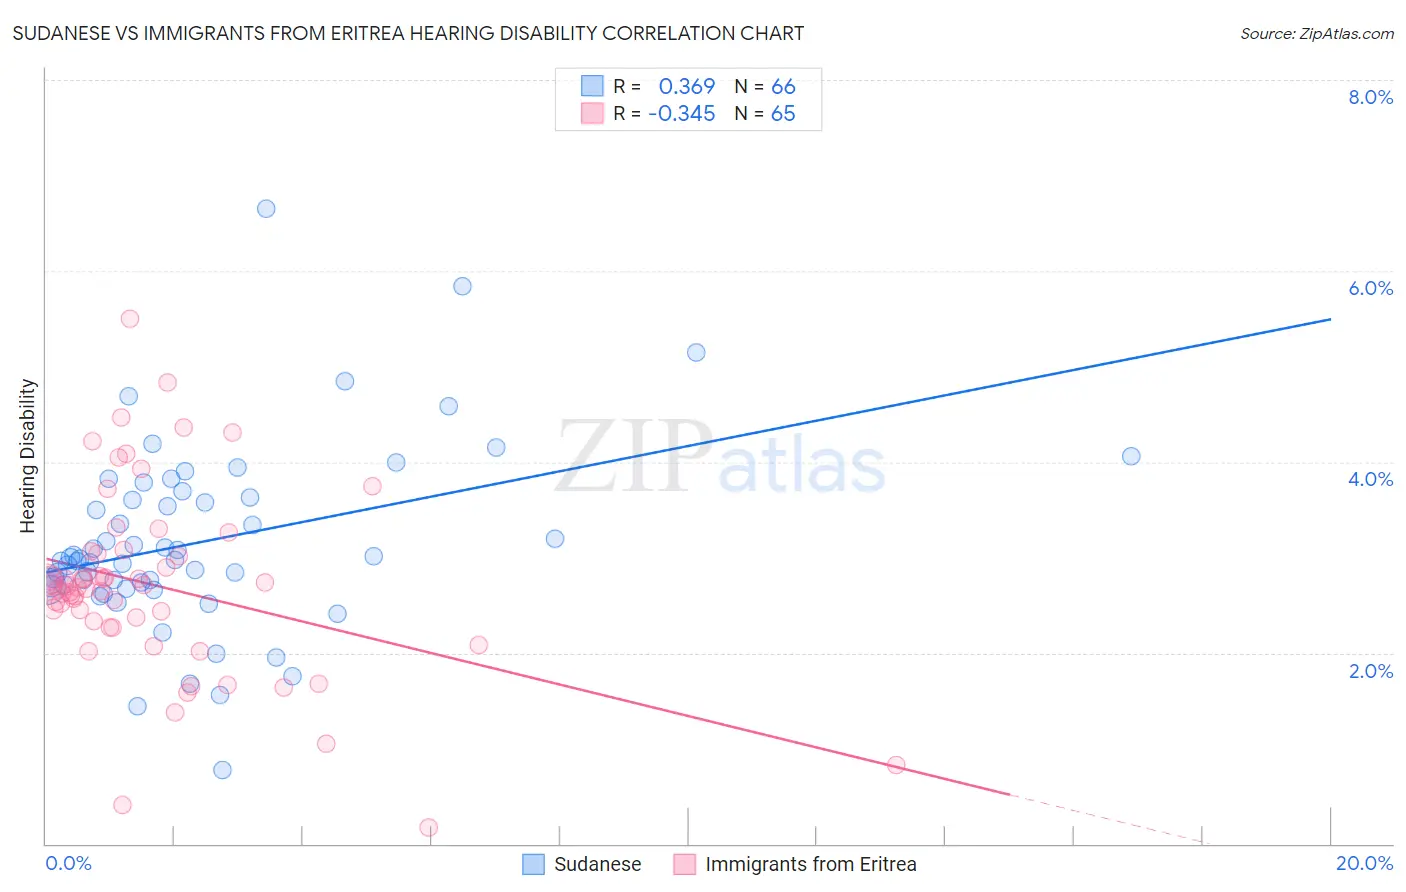
Sudanese vs Immigrants from Eritrea Hearing Disability Correlation Chart
The statistical analysis conducted on geographies consisting of 110,125,850 people shows a mild positive correlation between the proportion of Sudanese and percentage of population with hearing disability in the United States with a correlation coefficient (R) of 0.369 and weighted average of 2.9%. Similarly, the statistical analysis conducted on geographies consisting of 104,850,181 people shows a mild negative correlation between the proportion of Immigrants from Eritrea and percentage of population with hearing disability in the United States with a correlation coefficient (R) of -0.345 and weighted average of 2.7%, a difference of 8.5%.
Hearing Disability Correlation Summary
| Measurement | Sudanese | Immigrants from Eritrea |
| Minimum | 0.77% | 0.17% |
| Maximum | 6.7% | 5.5% |
| Range | 5.9% | 5.3% |
| Mean | 3.2% | 2.7% |
| Median | 3.0% | 2.7% |
| Interquartile 25% (IQ1) | 2.7% | 2.3% |
| Interquartile 75% (IQ3) | 3.6% | 3.0% |
| Interquartile Range (IQR) | 0.92% | 0.75% |
| Standard Deviation (Sample) | 0.97% | 0.97% |
| Standard Deviation (Population) | 0.96% | 0.96% |
Similar Demographics by Hearing Disability
Demographics Similar to Sudanese by Hearing Disability
In terms of hearing disability, the demographic groups most similar to Sudanese are Immigrants from Lebanon (2.9%, a difference of 0.070%), Costa Rican (2.9%, a difference of 0.090%), Immigrants from Lithuania (2.9%, a difference of 0.11%), Immigrants from France (2.9%, a difference of 0.12%), and Palestinian (2.9%, a difference of 0.18%).
| Demographics | Rating | Rank | Hearing Disability |
| Brazilians | 78.7 /100 | #146 | Good 2.9% |
| Tongans | 78.6 /100 | #147 | Good 2.9% |
| Immigrants | Russia | 77.7 /100 | #148 | Good 2.9% |
| Immigrants | Panama | 76.9 /100 | #149 | Good 2.9% |
| Palestinians | 73.6 /100 | #150 | Good 2.9% |
| Immigrants | France | 73.1 /100 | #151 | Good 2.9% |
| Immigrants | Lithuania | 73.0 /100 | #152 | Good 2.9% |
| Sudanese | 72.1 /100 | #153 | Good 2.9% |
| Immigrants | Lebanon | 71.5 /100 | #154 | Good 2.9% |
| Costa Ricans | 71.4 /100 | #155 | Good 2.9% |
| Immigrants | Poland | 70.2 /100 | #156 | Good 2.9% |
| Immigrants | Kazakhstan | 69.6 /100 | #157 | Good 2.9% |
| Immigrants | Burma/Myanmar | 69.5 /100 | #158 | Good 2.9% |
| Immigrants | Australia | 67.4 /100 | #159 | Good 2.9% |
| Immigrants | Fiji | 67.1 /100 | #160 | Good 2.9% |
Demographics Similar to Immigrants from Eritrea by Hearing Disability
In terms of hearing disability, the demographic groups most similar to Immigrants from Eritrea are Immigrants from Egypt (2.7%, a difference of 0.070%), Immigrants from Peru (2.7%, a difference of 0.11%), Immigrants from Uzbekistan (2.7%, a difference of 0.20%), Immigrants from Colombia (2.7%, a difference of 0.21%), and Indian (Asian) (2.7%, a difference of 0.26%).
| Demographics | Rating | Rank | Hearing Disability |
| Jamaicans | 99.0 /100 | #52 | Exceptional 2.7% |
| Immigrants | Eastern Asia | 99.0 /100 | #53 | Exceptional 2.7% |
| Ethiopians | 99.0 /100 | #54 | Exceptional 2.7% |
| Immigrants | Ethiopia | 99.0 /100 | #55 | Exceptional 2.7% |
| Immigrants | Nicaragua | 99.0 /100 | #56 | Exceptional 2.7% |
| South Americans | 99.0 /100 | #57 | Exceptional 2.7% |
| Immigrants | Peru | 98.6 /100 | #58 | Exceptional 2.7% |
| Immigrants | Eritrea | 98.5 /100 | #59 | Exceptional 2.7% |
| Immigrants | Egypt | 98.5 /100 | #60 | Exceptional 2.7% |
| Immigrants | Uzbekistan | 98.4 /100 | #61 | Exceptional 2.7% |
| Immigrants | Colombia | 98.4 /100 | #62 | Exceptional 2.7% |
| Indians (Asian) | 98.4 /100 | #63 | Exceptional 2.7% |
| Immigrants | Sri Lanka | 98.4 /100 | #64 | Exceptional 2.7% |
| Immigrants | Nepal | 98.3 /100 | #65 | Exceptional 2.7% |
| Immigrants | Belize | 98.2 /100 | #66 | Exceptional 2.7% |