Subsaharan African vs White/Caucasian Unemployment Among Ages 45 to 54 years
COMPARE
Subsaharan African
White/Caucasian
Unemployment Among Ages 45 to 54 years
Unemployment Among Ages 45 to 54 years Comparison
Sub-Saharan Africans
Whites/Caucasians
4.9%
UNEMPLOYMENT AMONG AGES 45 TO 54 YEARS
0.2/ 100
METRIC RATING
258th/ 347
METRIC RANK
4.3%
UNEMPLOYMENT AMONG AGES 45 TO 54 YEARS
98.4/ 100
METRIC RATING
72nd/ 347
METRIC RANK
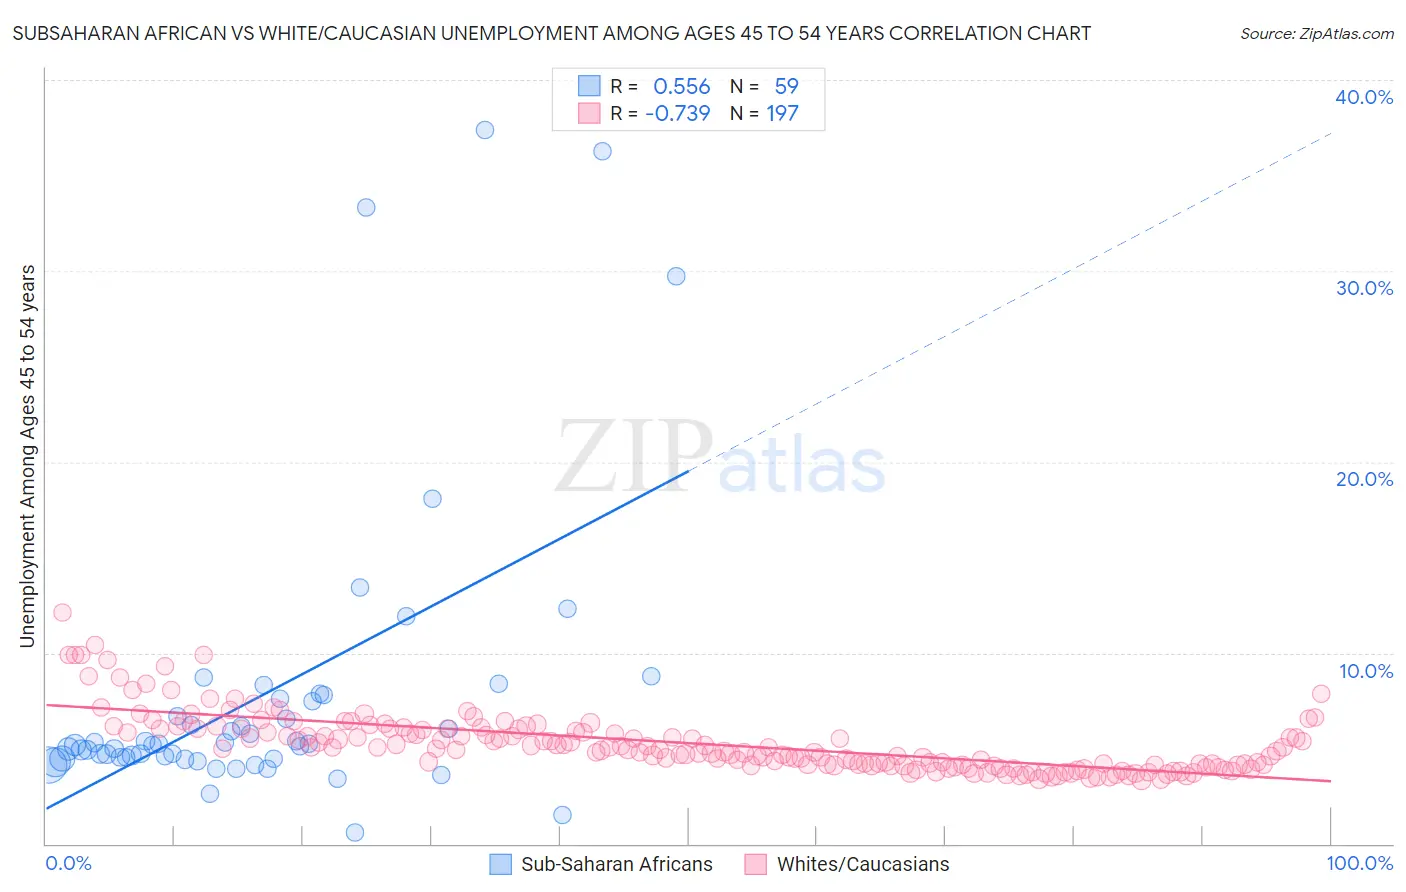
Subsaharan African vs White/Caucasian Unemployment Among Ages 45 to 54 years Correlation Chart
The statistical analysis conducted on geographies consisting of 486,803,720 people shows a substantial positive correlation between the proportion of Sub-Saharan Africans and unemployment rate among population between the ages 45 and 54 in the United States with a correlation coefficient (R) of 0.556 and weighted average of 4.9%. Similarly, the statistical analysis conducted on geographies consisting of 535,899,454 people shows a strong negative correlation between the proportion of Whites/Caucasians and unemployment rate among population between the ages 45 and 54 in the United States with a correlation coefficient (R) of -0.739 and weighted average of 4.3%, a difference of 12.9%.
Unemployment Among Ages 45 to 54 years Correlation Summary
| Measurement | Subsaharan African | White/Caucasian |
| Minimum | 0.60% | 3.3% |
| Maximum | 37.4% | 12.1% |
| Range | 36.8% | 8.8% |
| Mean | 7.8% | 5.3% |
| Median | 5.2% | 4.9% |
| Interquartile 25% (IQ1) | 4.5% | 4.1% |
| Interquartile 75% (IQ3) | 7.6% | 6.0% |
| Interquartile Range (IQR) | 3.1% | 1.9% |
| Standard Deviation (Sample) | 7.7% | 1.5% |
| Standard Deviation (Population) | 7.7% | 1.5% |
Similar Demographics by Unemployment Among Ages 45 to 54 years
Demographics Similar to Sub-Saharan Africans by Unemployment Among Ages 45 to 54 years
In terms of unemployment among ages 45 to 54 years, the demographic groups most similar to Sub-Saharan Africans are Immigrants from Western Africa (4.9%, a difference of 0.030%), Ugandan (4.9%, a difference of 0.15%), Mexican American Indian (4.9%, a difference of 0.16%), Guatemalan (4.9%, a difference of 0.17%), and Immigrants from Western Asia (4.8%, a difference of 0.18%).
| Demographics | Rating | Rank | Unemployment Among Ages 45 to 54 years |
| Hondurans | 0.4 /100 | #251 | Tragic 4.8% |
| Immigrants | Bahamas | 0.3 /100 | #252 | Tragic 4.8% |
| Moroccans | 0.3 /100 | #253 | Tragic 4.8% |
| Immigrants | Lebanon | 0.2 /100 | #254 | Tragic 4.8% |
| Immigrants | El Salvador | 0.2 /100 | #255 | Tragic 4.8% |
| Immigrants | Western Asia | 0.2 /100 | #256 | Tragic 4.8% |
| Immigrants | Western Africa | 0.2 /100 | #257 | Tragic 4.9% |
| Sub-Saharan Africans | 0.2 /100 | #258 | Tragic 4.9% |
| Ugandans | 0.1 /100 | #259 | Tragic 4.9% |
| Mexican American Indians | 0.1 /100 | #260 | Tragic 4.9% |
| Guatemalans | 0.1 /100 | #261 | Tragic 4.9% |
| Mexicans | 0.1 /100 | #262 | Tragic 4.9% |
| Immigrants | Fiji | 0.1 /100 | #263 | Tragic 4.9% |
| Immigrants | Guatemala | 0.1 /100 | #264 | Tragic 4.9% |
| Immigrants | Somalia | 0.1 /100 | #265 | Tragic 4.9% |
Demographics Similar to Whites/Caucasians by Unemployment Among Ages 45 to 54 years
In terms of unemployment among ages 45 to 54 years, the demographic groups most similar to Whites/Caucasians are Palestinian (4.3%, a difference of 0.030%), Paraguayan (4.3%, a difference of 0.11%), Canadian (4.3%, a difference of 0.18%), Immigrants from Belgium (4.3%, a difference of 0.19%), and Kenyan (4.3%, a difference of 0.22%).
| Demographics | Rating | Rank | Unemployment Among Ages 45 to 54 years |
| Immigrants | Sudan | 99.0 /100 | #65 | Exceptional 4.3% |
| Turks | 98.9 /100 | #66 | Exceptional 4.3% |
| Immigrants | Nepal | 98.9 /100 | #67 | Exceptional 4.3% |
| Slovaks | 98.8 /100 | #68 | Exceptional 4.3% |
| Immigrants | Japan | 98.7 /100 | #69 | Exceptional 4.3% |
| Paraguayans | 98.6 /100 | #70 | Exceptional 4.3% |
| Palestinians | 98.5 /100 | #71 | Exceptional 4.3% |
| Whites/Caucasians | 98.4 /100 | #72 | Exceptional 4.3% |
| Canadians | 98.2 /100 | #73 | Exceptional 4.3% |
| Immigrants | Belgium | 98.2 /100 | #74 | Exceptional 4.3% |
| Kenyans | 98.1 /100 | #75 | Exceptional 4.3% |
| Slavs | 98.1 /100 | #76 | Exceptional 4.3% |
| Chileans | 98.1 /100 | #77 | Exceptional 4.3% |
| German Russians | 97.9 /100 | #78 | Exceptional 4.3% |
| Serbians | 97.9 /100 | #79 | Exceptional 4.3% |