Subsaharan African vs White/Caucasian Unemployment Among Ages 35 to 44 years
COMPARE
Subsaharan African
White/Caucasian
Unemployment Among Ages 35 to 44 years
Unemployment Among Ages 35 to 44 years Comparison
Sub-Saharan Africans
Whites/Caucasians
5.3%
UNEMPLOYMENT AMONG AGES 35 TO 44 YEARS
0.1/ 100
METRIC RATING
260th/ 347
METRIC RANK
4.6%
UNEMPLOYMENT AMONG AGES 35 TO 44 YEARS
64.9/ 100
METRIC RATING
155th/ 347
METRIC RANK
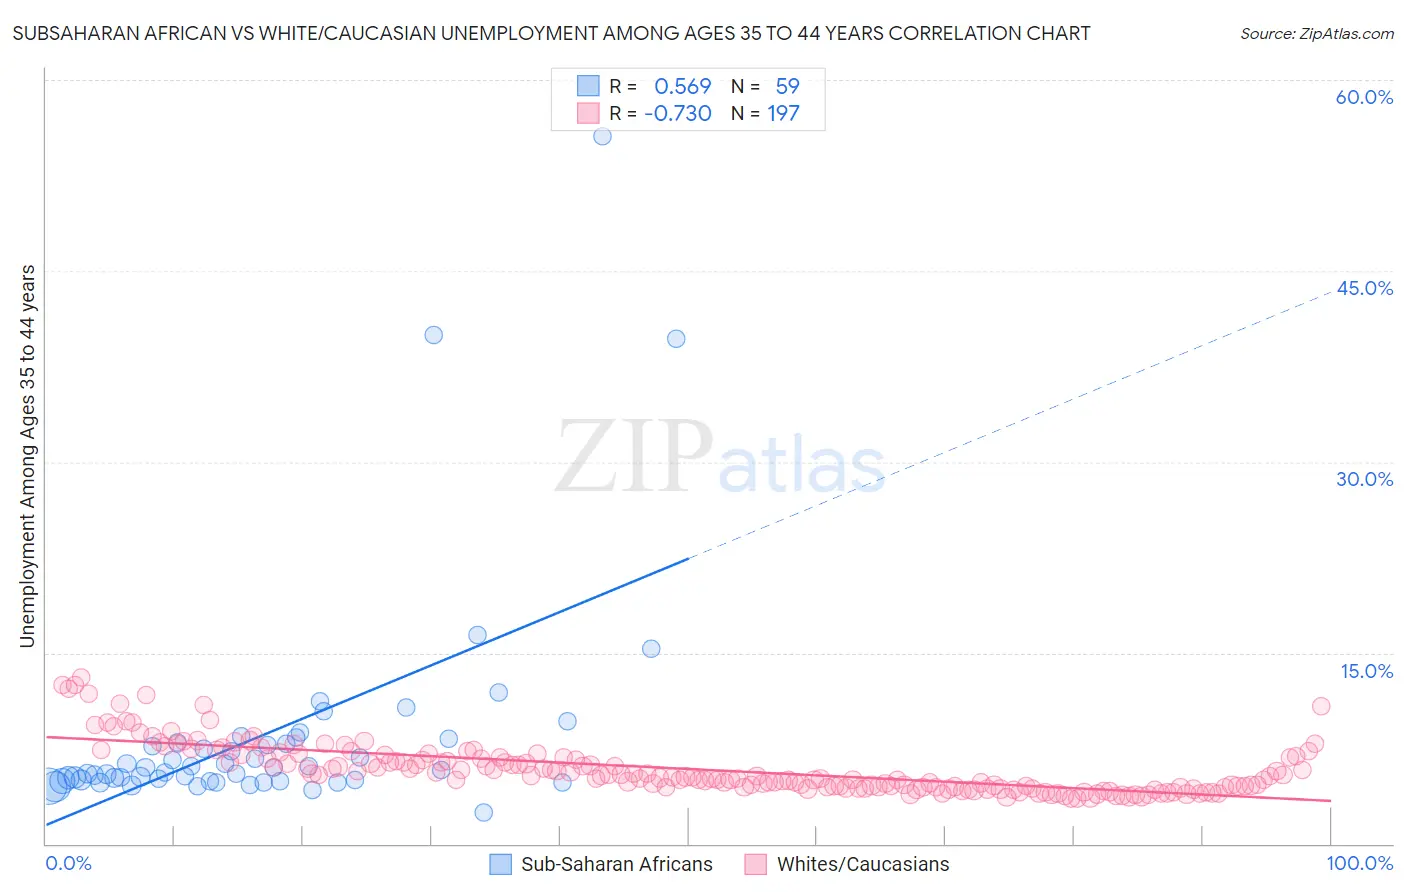
Subsaharan African vs White/Caucasian Unemployment Among Ages 35 to 44 years Correlation Chart
The statistical analysis conducted on geographies consisting of 489,916,914 people shows a substantial positive correlation between the proportion of Sub-Saharan Africans and unemployment rate among population between the ages 35 and 44 in the United States with a correlation coefficient (R) of 0.569 and weighted average of 5.3%. Similarly, the statistical analysis conducted on geographies consisting of 539,752,608 people shows a strong negative correlation between the proportion of Whites/Caucasians and unemployment rate among population between the ages 35 and 44 in the United States with a correlation coefficient (R) of -0.730 and weighted average of 4.6%, a difference of 13.6%.
Unemployment Among Ages 35 to 44 years Correlation Summary
| Measurement | Subsaharan African | White/Caucasian |
| Minimum | 2.5% | 3.6% |
| Maximum | 55.6% | 13.1% |
| Range | 53.1% | 9.5% |
| Mean | 8.6% | 5.9% |
| Median | 5.8% | 5.3% |
| Interquartile 25% (IQ1) | 4.9% | 4.4% |
| Interquartile 75% (IQ3) | 7.9% | 6.8% |
| Interquartile Range (IQR) | 3.0% | 2.3% |
| Standard Deviation (Sample) | 9.1% | 2.0% |
| Standard Deviation (Population) | 9.0% | 2.0% |
Similar Demographics by Unemployment Among Ages 35 to 44 years
Demographics Similar to Sub-Saharan Africans by Unemployment Among Ages 35 to 44 years
In terms of unemployment among ages 35 to 44 years, the demographic groups most similar to Sub-Saharan Africans are Mexican (5.3%, a difference of 0.030%), Immigrants from Latin America (5.3%, a difference of 0.13%), Spanish American (5.3%, a difference of 0.20%), Immigrants from Fiji (5.3%, a difference of 0.25%), and Seminole (5.2%, a difference of 0.53%).
| Demographics | Rating | Rank | Unemployment Among Ages 35 to 44 years |
| Mexican American Indians | 0.2 /100 | #253 | Tragic 5.2% |
| Immigrants | Bahamas | 0.2 /100 | #254 | Tragic 5.2% |
| Cherokee | 0.2 /100 | #255 | Tragic 5.2% |
| Seminole | 0.1 /100 | #256 | Tragic 5.2% |
| Immigrants | Fiji | 0.1 /100 | #257 | Tragic 5.3% |
| Immigrants | Latin America | 0.1 /100 | #258 | Tragic 5.3% |
| Mexicans | 0.1 /100 | #259 | Tragic 5.3% |
| Sub-Saharan Africans | 0.1 /100 | #260 | Tragic 5.3% |
| Spanish Americans | 0.1 /100 | #261 | Tragic 5.3% |
| Immigrants | Central America | 0.1 /100 | #262 | Tragic 5.3% |
| Choctaw | 0.1 /100 | #263 | Tragic 5.3% |
| Ghanaians | 0.1 /100 | #264 | Tragic 5.3% |
| Yaqui | 0.1 /100 | #265 | Tragic 5.3% |
| Immigrants | Bangladesh | 0.1 /100 | #266 | Tragic 5.3% |
| Immigrants | Western Africa | 0.0 /100 | #267 | Tragic 5.3% |
Demographics Similar to Whites/Caucasians by Unemployment Among Ages 35 to 44 years
In terms of unemployment among ages 35 to 44 years, the demographic groups most similar to Whites/Caucasians are Immigrants from Western Europe (4.6%, a difference of 0.050%), South American (4.6%, a difference of 0.090%), Immigrants from Belarus (4.6%, a difference of 0.11%), Immigrants from Iran (4.6%, a difference of 0.14%), and Albanian (4.6%, a difference of 0.15%).
| Demographics | Rating | Rank | Unemployment Among Ages 35 to 44 years |
| Slavs | 72.4 /100 | #148 | Good 4.6% |
| Immigrants | Burma/Myanmar | 72.2 /100 | #149 | Good 4.6% |
| Immigrants | England | 70.5 /100 | #150 | Good 4.6% |
| Puget Sound Salish | 67.1 /100 | #151 | Good 4.6% |
| Pakistanis | 67.1 /100 | #152 | Good 4.6% |
| Immigrants | Brazil | 67.0 /100 | #153 | Good 4.6% |
| Immigrants | Western Europe | 65.5 /100 | #154 | Good 4.6% |
| Whites/Caucasians | 64.9 /100 | #155 | Good 4.6% |
| South Americans | 63.7 /100 | #156 | Good 4.6% |
| Immigrants | Belarus | 63.4 /100 | #157 | Good 4.6% |
| Immigrants | Iran | 63.1 /100 | #158 | Good 4.6% |
| Albanians | 63.0 /100 | #159 | Good 4.6% |
| Hungarians | 62.6 /100 | #160 | Good 4.6% |
| Celtics | 61.7 /100 | #161 | Good 4.7% |
| Costa Ricans | 59.6 /100 | #162 | Average 4.7% |