Mongolian vs Thai Disability Age Over 75
COMPARE
Mongolian
Thai
Disability Age Over 75
Disability Age Over 75 Comparison
Mongolians
Thais
46.3%
DISABILITY AGE OVER 75
97.7/ 100
METRIC RATING
101st/ 347
METRIC RANK
45.4%
DISABILITY AGE OVER 75
99.9/ 100
METRIC RATING
28th/ 347
METRIC RANK
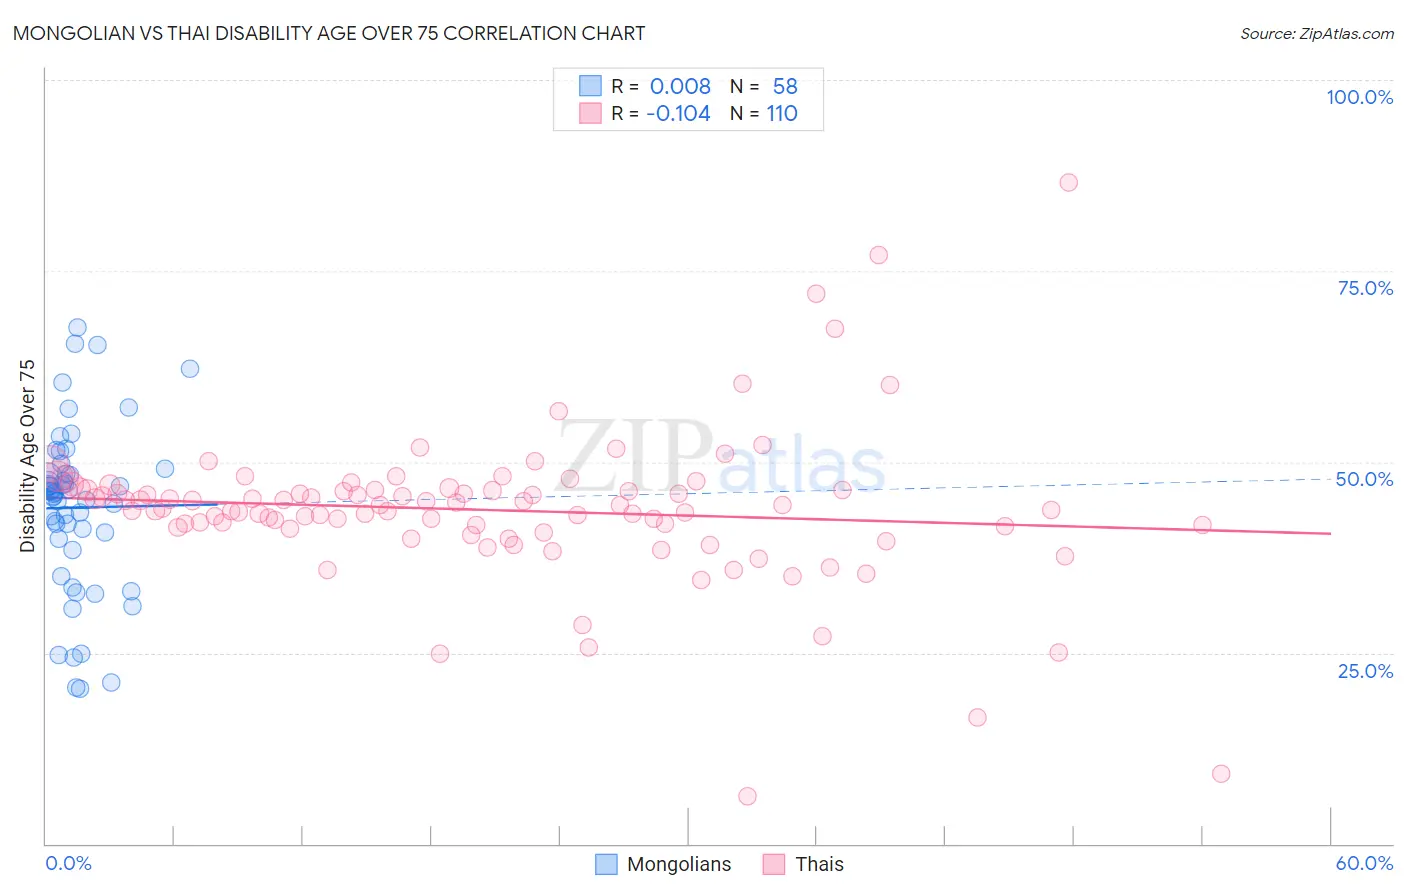
Mongolian vs Thai Disability Age Over 75 Correlation Chart
The statistical analysis conducted on geographies consisting of 140,199,354 people shows no correlation between the proportion of Mongolians and percentage of population with a disability over the age of 75 in the United States with a correlation coefficient (R) of 0.008 and weighted average of 46.3%. Similarly, the statistical analysis conducted on geographies consisting of 474,673,142 people shows a poor negative correlation between the proportion of Thais and percentage of population with a disability over the age of 75 in the United States with a correlation coefficient (R) of -0.104 and weighted average of 45.4%, a difference of 2.1%.
Disability Age Over 75 Correlation Summary
| Measurement | Mongolian | Thai |
| Minimum | 20.3% | 6.2% |
| Maximum | 67.6% | 86.5% |
| Range | 47.4% | 80.3% |
| Mean | 44.0% | 43.7% |
| Median | 45.9% | 44.1% |
| Interquartile 25% (IQ1) | 39.9% | 41.4% |
| Interquartile 75% (IQ3) | 48.5% | 46.3% |
| Interquartile Range (IQR) | 8.5% | 4.8% |
| Standard Deviation (Sample) | 10.9% | 10.2% |
| Standard Deviation (Population) | 10.8% | 10.1% |
Similar Demographics by Disability Age Over 75
Demographics Similar to Mongolians by Disability Age Over 75
In terms of disability age over 75, the demographic groups most similar to Mongolians are Palestinian (46.3%, a difference of 0.0%), Immigrants from Eastern Europe (46.3%, a difference of 0.0%), Immigrants from Japan (46.3%, a difference of 0.040%), Finnish (46.3%, a difference of 0.050%), and Immigrants from Brazil (46.3%, a difference of 0.080%).
| Demographics | Rating | Rank | Disability Age Over 75 |
| Albanians | 98.1 /100 | #94 | Exceptional 46.3% |
| Immigrants | Brazil | 98.0 /100 | #95 | Exceptional 46.3% |
| Immigrants | China | 98.0 /100 | #96 | Exceptional 46.3% |
| Finns | 97.9 /100 | #97 | Exceptional 46.3% |
| Immigrants | Japan | 97.8 /100 | #98 | Exceptional 46.3% |
| Palestinians | 97.7 /100 | #99 | Exceptional 46.3% |
| Immigrants | Eastern Europe | 97.7 /100 | #100 | Exceptional 46.3% |
| Mongolians | 97.7 /100 | #101 | Exceptional 46.3% |
| Immigrants | Malaysia | 97.1 /100 | #102 | Exceptional 46.4% |
| Ukrainians | 97.1 /100 | #103 | Exceptional 46.4% |
| Israelis | 97.0 /100 | #104 | Exceptional 46.4% |
| Immigrants | Cameroon | 96.9 /100 | #105 | Exceptional 46.4% |
| Immigrants | Kuwait | 96.8 /100 | #106 | Exceptional 46.4% |
| Immigrants | Uruguay | 96.7 /100 | #107 | Exceptional 46.4% |
| Brazilians | 96.6 /100 | #108 | Exceptional 46.5% |
Demographics Similar to Thais by Disability Age Over 75
In terms of disability age over 75, the demographic groups most similar to Thais are Immigrants from Poland (45.4%, a difference of 0.020%), Macedonian (45.4%, a difference of 0.040%), Filipino (45.4%, a difference of 0.040%), Immigrants from Bolivia (45.4%, a difference of 0.070%), and Immigrants from Denmark (45.4%, a difference of 0.070%).
| Demographics | Rating | Rank | Disability Age Over 75 |
| Immigrants | Belgium | 100.0 /100 | #21 | Exceptional 45.3% |
| Immigrants | South Africa | 100.0 /100 | #22 | Exceptional 45.3% |
| Immigrants | Switzerland | 99.9 /100 | #23 | Exceptional 45.3% |
| Poles | 99.9 /100 | #24 | Exceptional 45.3% |
| Immigrants | Bolivia | 99.9 /100 | #25 | Exceptional 45.4% |
| Macedonians | 99.9 /100 | #26 | Exceptional 45.4% |
| Immigrants | Poland | 99.9 /100 | #27 | Exceptional 45.4% |
| Thais | 99.9 /100 | #28 | Exceptional 45.4% |
| Filipinos | 99.9 /100 | #29 | Exceptional 45.4% |
| Immigrants | Denmark | 99.9 /100 | #30 | Exceptional 45.4% |
| Immigrants | Bulgaria | 99.9 /100 | #31 | Exceptional 45.5% |
| Immigrants | Australia | 99.9 /100 | #32 | Exceptional 45.5% |
| Immigrants | Croatia | 99.9 /100 | #33 | Exceptional 45.5% |
| Russians | 99.9 /100 | #34 | Exceptional 45.5% |
| Norwegians | 99.9 /100 | #35 | Exceptional 45.5% |