Subsaharan African vs Immigrants from Thailand 11th Grade
COMPARE
Subsaharan African
Immigrants from Thailand
11th Grade
11th Grade Comparison
Sub-Saharan Africans
Immigrants from Thailand
91.7%
11TH GRADE
2.9/ 100
METRIC RATING
235th/ 347
METRIC RANK
91.6%
11TH GRADE
1.4/ 100
METRIC RATING
243rd/ 347
METRIC RANK
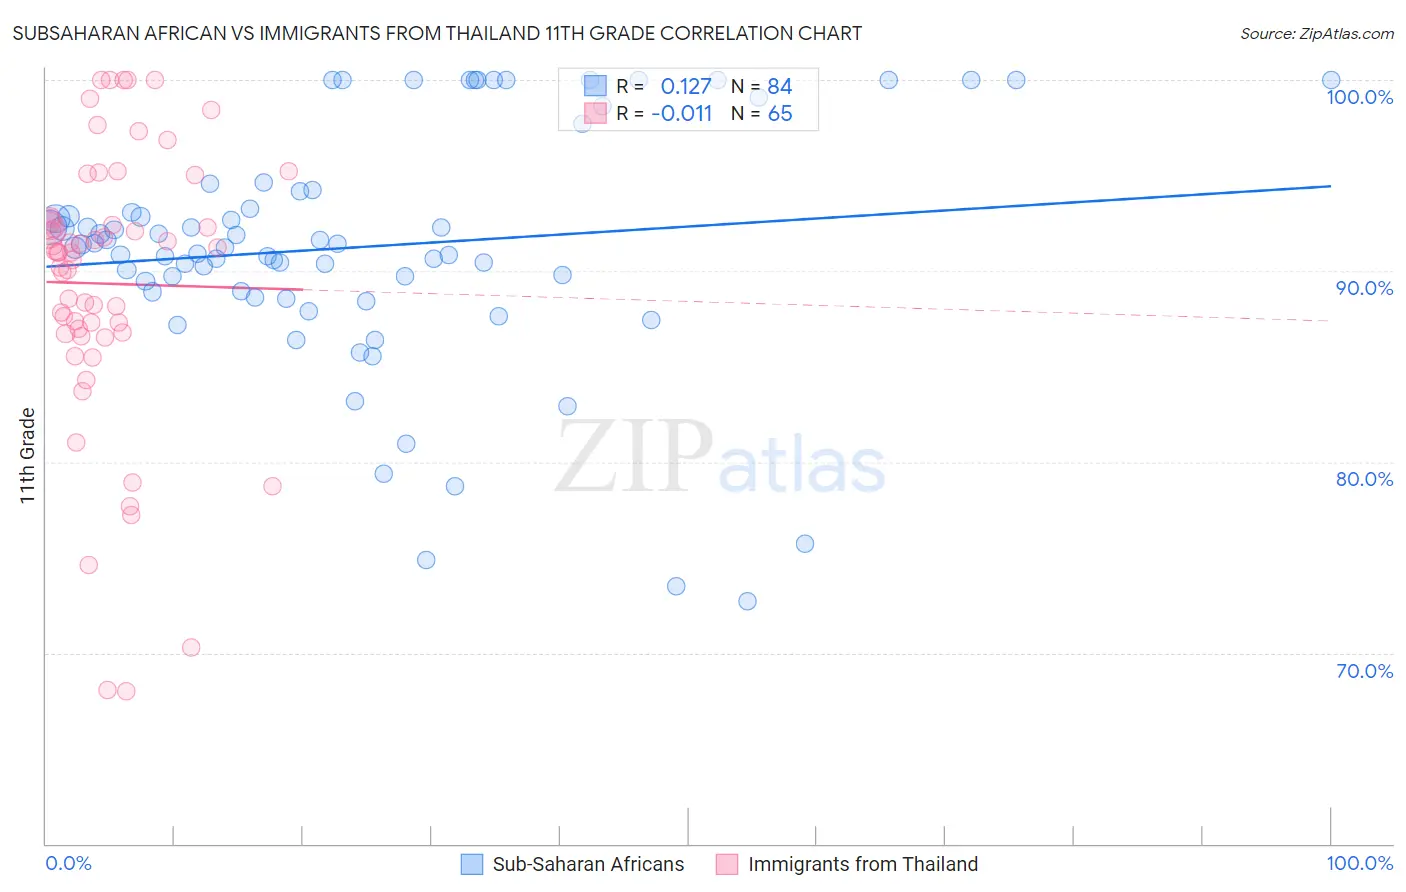
Subsaharan African vs Immigrants from Thailand 11th Grade Correlation Chart
The statistical analysis conducted on geographies consisting of 508,219,008 people shows a poor positive correlation between the proportion of Sub-Saharan Africans and percentage of population with at least 11th grade education in the United States with a correlation coefficient (R) of 0.127 and weighted average of 91.7%. Similarly, the statistical analysis conducted on geographies consisting of 317,023,903 people shows no correlation between the proportion of Immigrants from Thailand and percentage of population with at least 11th grade education in the United States with a correlation coefficient (R) of -0.011 and weighted average of 91.6%, a difference of 0.18%.
11th Grade Correlation Summary
| Measurement | Subsaharan African | Immigrants from Thailand |
| Minimum | 72.7% | 68.0% |
| Maximum | 100.0% | 100.0% |
| Range | 27.3% | 32.0% |
| Mean | 91.3% | 89.3% |
| Median | 91.3% | 91.0% |
| Interquartile 25% (IQ1) | 88.9% | 86.8% |
| Interquartile 75% (IQ3) | 94.2% | 92.7% |
| Interquartile Range (IQR) | 5.3% | 5.9% |
| Standard Deviation (Sample) | 6.3% | 7.3% |
| Standard Deviation (Population) | 6.3% | 7.3% |
Demographics Similar to Sub-Saharan Africans and Immigrants from Thailand by 11th Grade
In terms of 11th grade, the demographic groups most similar to Sub-Saharan Africans are Armenian (91.7%, a difference of 0.0%), Colombian (91.7%, a difference of 0.0%), Immigrants from Bolivia (91.7%, a difference of 0.0%), Cheyenne (91.8%, a difference of 0.030%), and Comanche (91.7%, a difference of 0.030%). Similarly, the demographic groups most similar to Immigrants from Thailand are Senegalese (91.6%, a difference of 0.010%), African (91.5%, a difference of 0.020%), Immigrants from Middle Africa (91.6%, a difference of 0.030%), Seminole (91.5%, a difference of 0.050%), and Bahamian (91.6%, a difference of 0.060%).
| Demographics | Rating | Rank | 11th Grade |
| Nigerians | 4.3 /100 | #229 | Tragic 91.8% |
| Immigrants | Afghanistan | 3.9 /100 | #230 | Tragic 91.8% |
| Choctaw | 3.7 /100 | #231 | Tragic 91.8% |
| Uruguayans | 3.5 /100 | #232 | Tragic 91.8% |
| Cheyenne | 3.3 /100 | #233 | Tragic 91.8% |
| Armenians | 2.9 /100 | #234 | Tragic 91.7% |
| Sub-Saharan Africans | 2.9 /100 | #235 | Tragic 91.7% |
| Colombians | 2.8 /100 | #236 | Tragic 91.7% |
| Immigrants | Bolivia | 2.8 /100 | #237 | Tragic 91.7% |
| Comanche | 2.6 /100 | #238 | Tragic 91.7% |
| Hopi | 2.5 /100 | #239 | Tragic 91.7% |
| South Americans | 2.0 /100 | #240 | Tragic 91.6% |
| Bahamians | 1.8 /100 | #241 | Tragic 91.6% |
| Immigrants | Middle Africa | 1.6 /100 | #242 | Tragic 91.6% |
| Immigrants | Thailand | 1.4 /100 | #243 | Tragic 91.6% |
| Senegalese | 1.4 /100 | #244 | Tragic 91.6% |
| Africans | 1.3 /100 | #245 | Tragic 91.5% |
| Seminole | 1.2 /100 | #246 | Tragic 91.5% |
| Immigrants | Philippines | 1.0 /100 | #247 | Tragic 91.5% |
| Immigrants | Uzbekistan | 1.0 /100 | #248 | Tragic 91.5% |
| Peruvians | 1.0 /100 | #249 | Tragic 91.5% |