Spanish vs Pennsylvania German Single Male Poverty
COMPARE
Spanish
Pennsylvania German
Single Male Poverty
Single Male Poverty Comparison
Spanish
Pennsylvania Germans
13.6%
SINGLE MALE POVERTY
1.0/ 100
METRIC RATING
249th/ 347
METRIC RANK
15.6%
SINGLE MALE POVERTY
0.0/ 100
METRIC RATING
306th/ 347
METRIC RANK
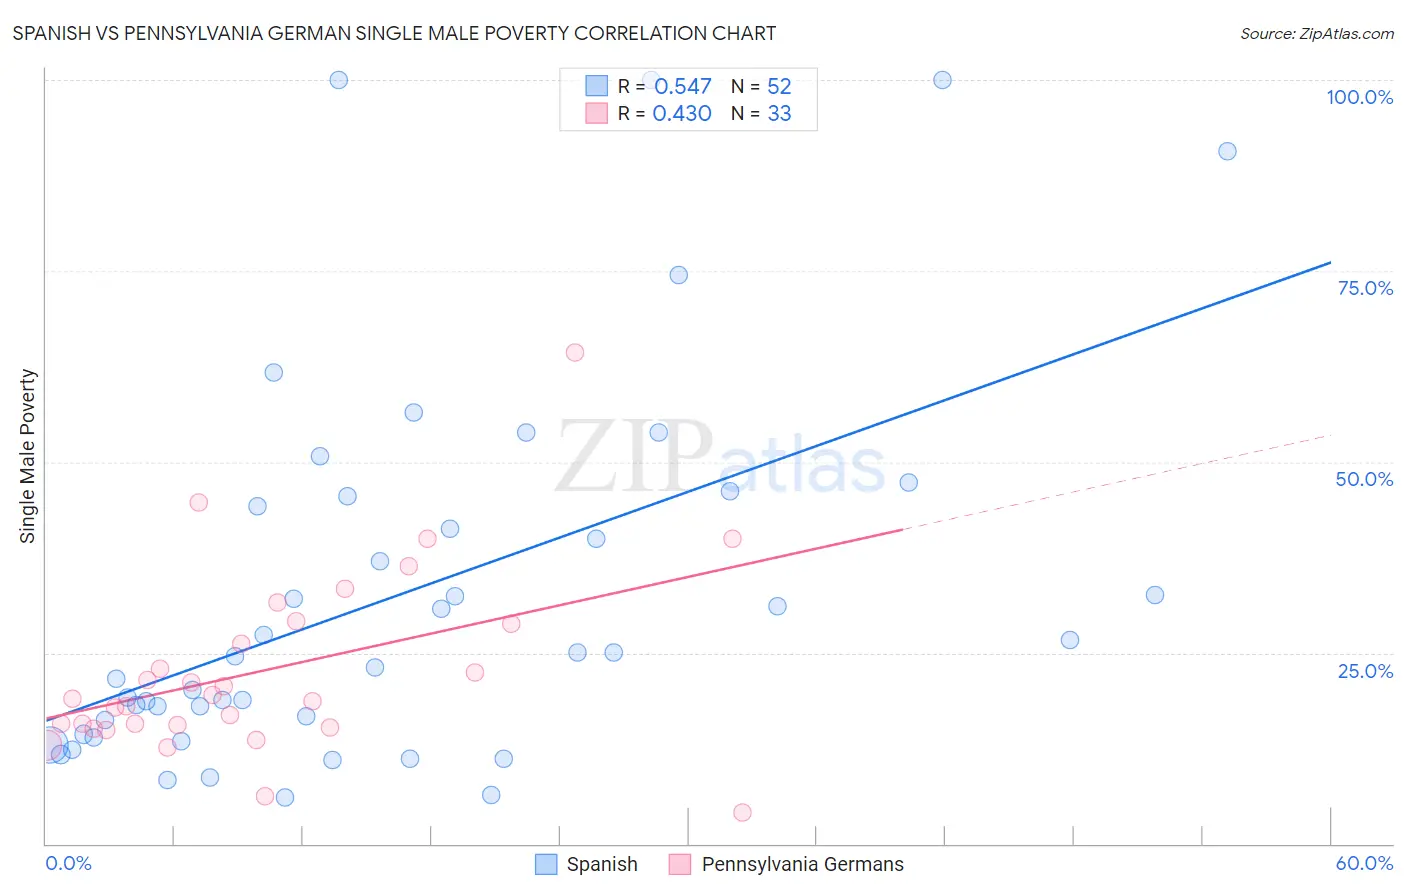
Spanish vs Pennsylvania German Single Male Poverty Correlation Chart
The statistical analysis conducted on geographies consisting of 373,377,488 people shows a substantial positive correlation between the proportion of Spanish and poverty level among single males in the United States with a correlation coefficient (R) of 0.547 and weighted average of 13.6%. Similarly, the statistical analysis conducted on geographies consisting of 211,597,863 people shows a moderate positive correlation between the proportion of Pennsylvania Germans and poverty level among single males in the United States with a correlation coefficient (R) of 0.430 and weighted average of 15.6%, a difference of 14.7%.
Single Male Poverty Correlation Summary
| Measurement | Spanish | Pennsylvania German |
| Minimum | 6.1% | 4.0% |
| Maximum | 100.0% | 64.3% |
| Range | 93.9% | 60.3% |
| Mean | 32.7% | 22.7% |
| Median | 24.8% | 19.0% |
| Interquartile 25% (IQ1) | 15.3% | 15.3% |
| Interquartile 75% (IQ3) | 44.8% | 29.0% |
| Interquartile Range (IQR) | 29.6% | 13.6% |
| Standard Deviation (Sample) | 24.7% | 12.1% |
| Standard Deviation (Population) | 24.4% | 11.9% |
Similar Demographics by Single Male Poverty
Demographics Similar to Spanish by Single Male Poverty
In terms of single male poverty, the demographic groups most similar to Spanish are Immigrants from Somalia (13.6%, a difference of 0.020%), Immigrants from Zaire (13.6%, a difference of 0.13%), Finnish (13.6%, a difference of 0.17%), Czech (13.5%, a difference of 0.24%), and Belgian (13.5%, a difference of 0.27%).
| Demographics | Rating | Rank | Single Male Poverty |
| Carpatho Rusyns | 2.1 /100 | #242 | Tragic 13.4% |
| Barbadians | 2.1 /100 | #243 | Tragic 13.4% |
| Immigrants | Senegal | 1.7 /100 | #244 | Tragic 13.5% |
| Immigrants | Latin America | 1.3 /100 | #245 | Tragic 13.5% |
| Immigrants | Micronesia | 1.2 /100 | #246 | Tragic 13.5% |
| Belgians | 1.2 /100 | #247 | Tragic 13.5% |
| Czechs | 1.2 /100 | #248 | Tragic 13.5% |
| Spanish | 1.0 /100 | #249 | Tragic 13.6% |
| Immigrants | Somalia | 1.0 /100 | #250 | Tragic 13.6% |
| Immigrants | Zaire | 0.9 /100 | #251 | Tragic 13.6% |
| Finns | 0.9 /100 | #252 | Tragic 13.6% |
| German Russians | 0.8 /100 | #253 | Tragic 13.6% |
| Sub-Saharan Africans | 0.5 /100 | #254 | Tragic 13.7% |
| Spaniards | 0.4 /100 | #255 | Tragic 13.7% |
| Immigrants | Belize | 0.4 /100 | #256 | Tragic 13.7% |
Demographics Similar to Pennsylvania Germans by Single Male Poverty
In terms of single male poverty, the demographic groups most similar to Pennsylvania Germans are Blackfeet (15.5%, a difference of 0.43%), Ute (15.7%, a difference of 0.75%), Alaska Native (15.4%, a difference of 0.96%), Aleut (15.4%, a difference of 1.1%), and Potawatomi (15.8%, a difference of 1.3%).
| Demographics | Rating | Rank | Single Male Poverty |
| Delaware | 0.0 /100 | #299 | Tragic 15.0% |
| Cree | 0.0 /100 | #300 | Tragic 15.1% |
| Dominicans | 0.0 /100 | #301 | Tragic 15.2% |
| Alsatians | 0.0 /100 | #302 | Tragic 15.2% |
| Aleuts | 0.0 /100 | #303 | Tragic 15.4% |
| Alaska Natives | 0.0 /100 | #304 | Tragic 15.4% |
| Blackfeet | 0.0 /100 | #305 | Tragic 15.5% |
| Pennsylvania Germans | 0.0 /100 | #306 | Tragic 15.6% |
| Ute | 0.0 /100 | #307 | Tragic 15.7% |
| Potawatomi | 0.0 /100 | #308 | Tragic 15.8% |
| Americans | 0.0 /100 | #309 | Tragic 15.8% |
| Yakama | 0.0 /100 | #310 | Tragic 15.9% |
| Seminole | 0.0 /100 | #311 | Tragic 16.0% |
| Comanche | 0.0 /100 | #312 | Tragic 16.0% |
| Cherokee | 0.0 /100 | #313 | Tragic 16.1% |