Cambodian vs Pennsylvania German Female Disability
COMPARE
Cambodian
Pennsylvania German
Female Disability
Female Disability Comparison
Cambodians
Pennsylvania Germans
11.3%
FEMALE DISABILITY
100.0/ 100
METRIC RATING
44th/ 347
METRIC RANK
13.4%
FEMALE DISABILITY
0.0/ 100
METRIC RATING
300th/ 347
METRIC RANK
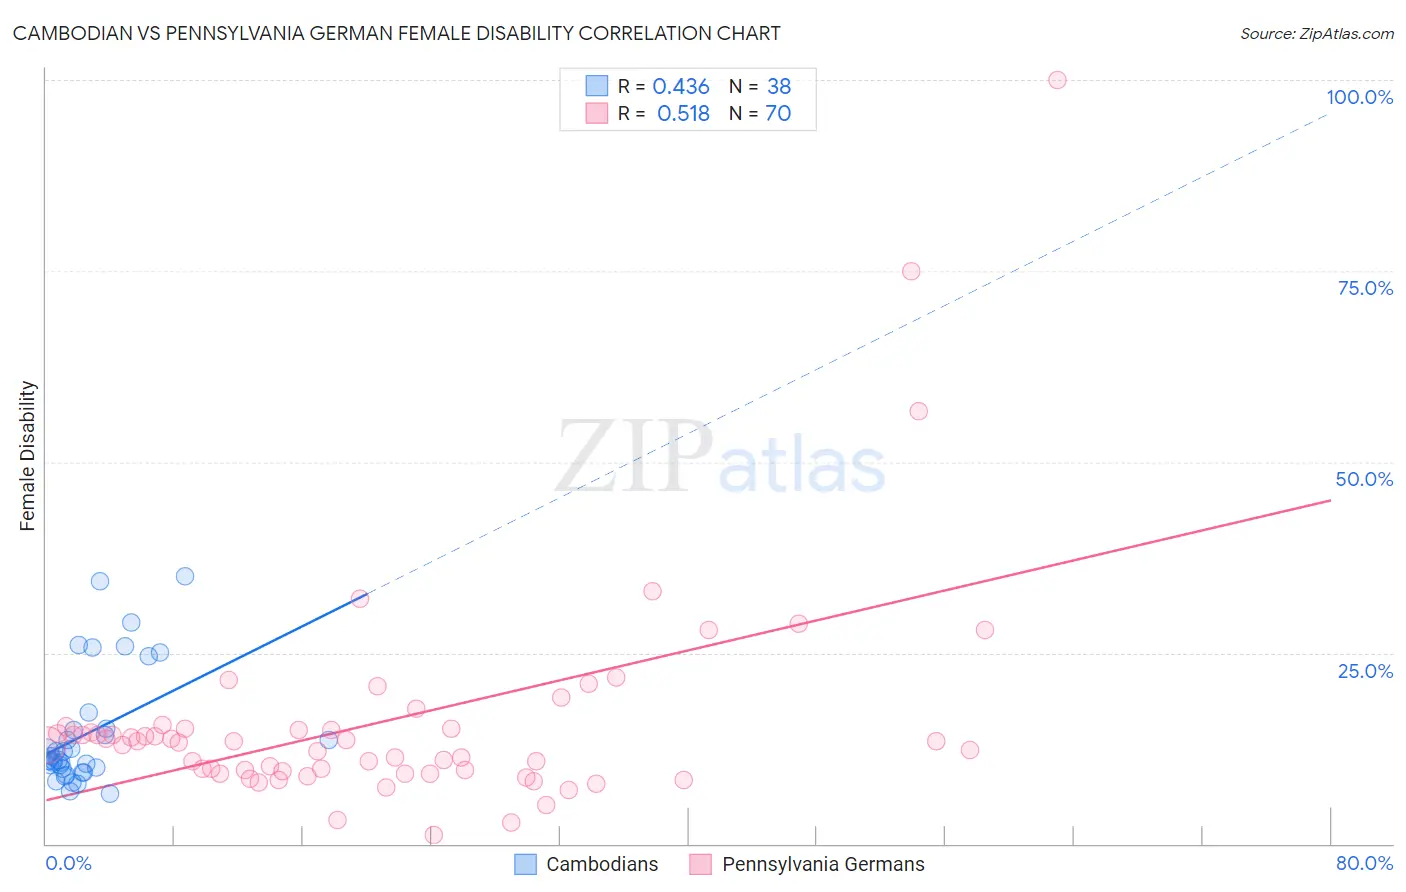
Cambodian vs Pennsylvania German Female Disability Correlation Chart
The statistical analysis conducted on geographies consisting of 102,507,228 people shows a moderate positive correlation between the proportion of Cambodians and percentage of females with a disability in the United States with a correlation coefficient (R) of 0.436 and weighted average of 11.3%. Similarly, the statistical analysis conducted on geographies consisting of 234,097,367 people shows a substantial positive correlation between the proportion of Pennsylvania Germans and percentage of females with a disability in the United States with a correlation coefficient (R) of 0.518 and weighted average of 13.4%, a difference of 19.0%.
Female Disability Correlation Summary
| Measurement | Cambodian | Pennsylvania German |
| Minimum | 6.5% | 1.2% |
| Maximum | 35.1% | 100.0% |
| Range | 28.6% | 98.8% |
| Mean | 14.5% | 16.0% |
| Median | 11.2% | 13.3% |
| Interquartile 25% (IQ1) | 9.9% | 9.4% |
| Interquartile 75% (IQ3) | 15.1% | 15.1% |
| Interquartile Range (IQR) | 5.2% | 5.6% |
| Standard Deviation (Sample) | 7.7% | 14.9% |
| Standard Deviation (Population) | 7.6% | 14.8% |
Similar Demographics by Female Disability
Demographics Similar to Cambodians by Female Disability
In terms of female disability, the demographic groups most similar to Cambodians are Immigrants from Sweden (11.3%, a difference of 0.040%), Immigrants from Nepal (11.3%, a difference of 0.080%), Jordanian (11.3%, a difference of 0.10%), Zimbabwean (11.3%, a difference of 0.11%), and Tongan (11.3%, a difference of 0.12%).
| Demographics | Rating | Rank | Female Disability |
| Ethiopians | 100.0 /100 | #37 | Exceptional 11.2% |
| Immigrants | Ethiopia | 100.0 /100 | #38 | Exceptional 11.2% |
| Immigrants | Lithuania | 100.0 /100 | #39 | Exceptional 11.2% |
| Mongolians | 100.0 /100 | #40 | Exceptional 11.2% |
| Paraguayans | 100.0 /100 | #41 | Exceptional 11.2% |
| Israelis | 100.0 /100 | #42 | Exceptional 11.2% |
| Afghans | 100.0 /100 | #43 | Exceptional 11.2% |
| Cambodians | 100.0 /100 | #44 | Exceptional 11.3% |
| Immigrants | Sweden | 100.0 /100 | #45 | Exceptional 11.3% |
| Immigrants | Nepal | 100.0 /100 | #46 | Exceptional 11.3% |
| Jordanians | 100.0 /100 | #47 | Exceptional 11.3% |
| Zimbabweans | 100.0 /100 | #48 | Exceptional 11.3% |
| Tongans | 100.0 /100 | #49 | Exceptional 11.3% |
| Inupiat | 100.0 /100 | #50 | Exceptional 11.3% |
| Immigrants | Belgium | 100.0 /100 | #51 | Exceptional 11.3% |
Demographics Similar to Pennsylvania Germans by Female Disability
In terms of female disability, the demographic groups most similar to Pennsylvania Germans are Immigrants from Dominican Republic (13.4%, a difference of 0.010%), African (13.4%, a difference of 0.20%), Nonimmigrants (13.4%, a difference of 0.27%), Scotch-Irish (13.4%, a difference of 0.34%), and Immigrants from Portugal (13.5%, a difference of 0.34%).
| Demographics | Rating | Rank | Female Disability |
| Marshallese | 0.0 /100 | #293 | Tragic 13.3% |
| Celtics | 0.0 /100 | #294 | Tragic 13.3% |
| French | 0.0 /100 | #295 | Tragic 13.3% |
| Nepalese | 0.0 /100 | #296 | Tragic 13.3% |
| Slovaks | 0.0 /100 | #297 | Tragic 13.3% |
| Immigrants | Nonimmigrants | 0.0 /100 | #298 | Tragic 13.4% |
| Immigrants | Dominican Republic | 0.0 /100 | #299 | Tragic 13.4% |
| Pennsylvania Germans | 0.0 /100 | #300 | Tragic 13.4% |
| Africans | 0.0 /100 | #301 | Tragic 13.4% |
| Scotch-Irish | 0.0 /100 | #302 | Tragic 13.4% |
| Immigrants | Portugal | 0.0 /100 | #303 | Tragic 13.5% |
| Immigrants | Micronesia | 0.0 /100 | #304 | Tragic 13.5% |
| Dominicans | 0.0 /100 | #305 | Tragic 13.5% |
| French Canadians | 0.0 /100 | #306 | Tragic 13.6% |
| Central American Indians | 0.0 /100 | #307 | Tragic 13.6% |