Spanish vs German Male Poverty
COMPARE
Spanish
German
Male Poverty
Male Poverty Comparison
Spanish
Germans
11.7%
MALE POVERTY
14.1/ 100
METRIC RATING
199th/ 347
METRIC RANK
10.1%
MALE POVERTY
98.3/ 100
METRIC RATING
55th/ 347
METRIC RANK
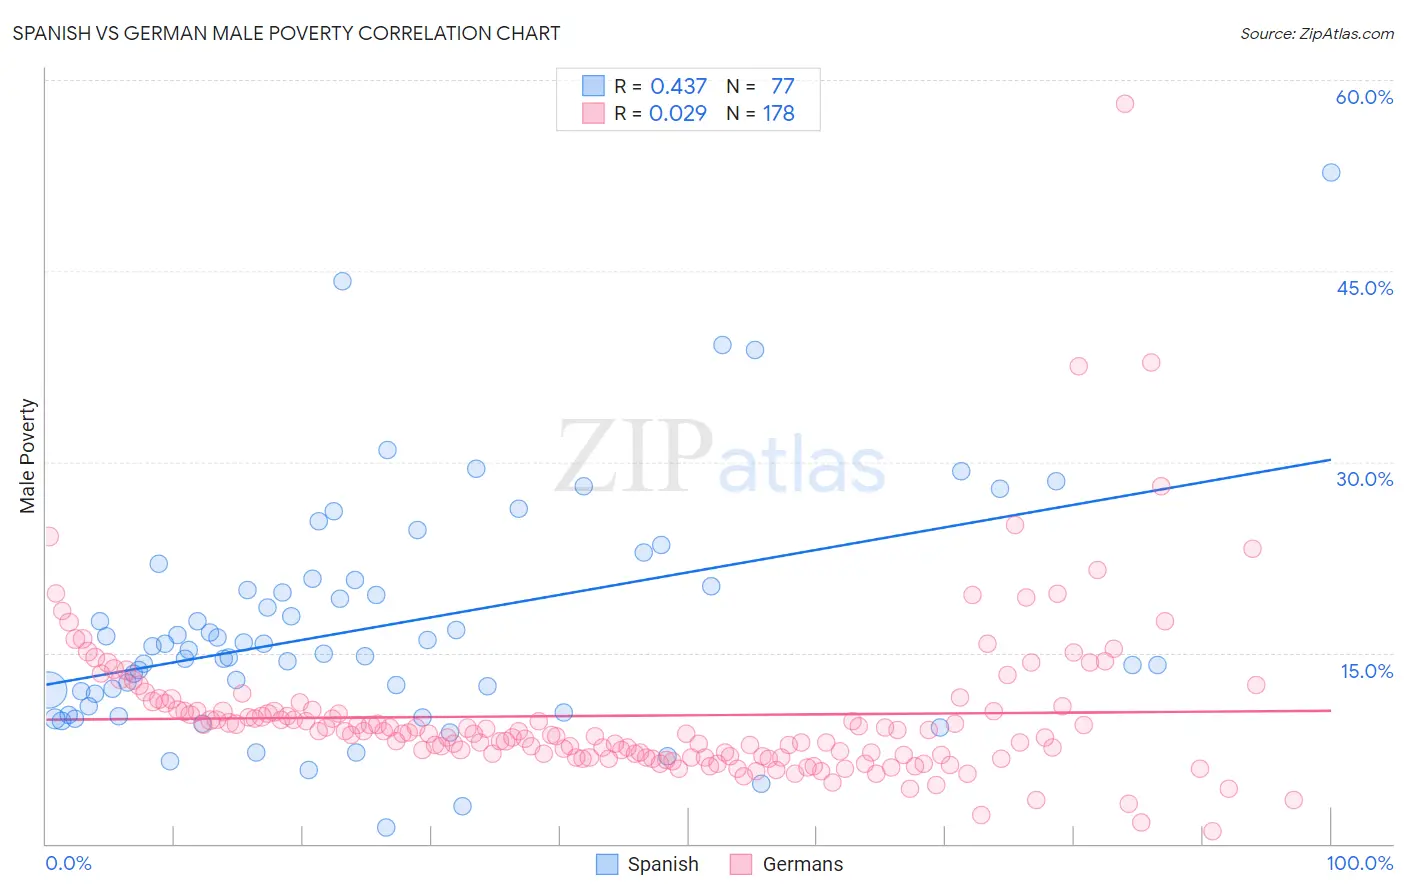
Spanish vs German Male Poverty Correlation Chart
The statistical analysis conducted on geographies consisting of 421,778,178 people shows a moderate positive correlation between the proportion of Spanish and poverty level among males in the United States with a correlation coefficient (R) of 0.437 and weighted average of 11.7%. Similarly, the statistical analysis conducted on geographies consisting of 578,875,550 people shows no correlation between the proportion of Germans and poverty level among males in the United States with a correlation coefficient (R) of 0.029 and weighted average of 10.1%, a difference of 16.0%.
Male Poverty Correlation Summary
| Measurement | Spanish | German |
| Minimum | 1.2% | 1.0% |
| Maximum | 52.7% | 58.2% |
| Range | 51.5% | 57.2% |
| Mean | 17.1% | 10.1% |
| Median | 15.2% | 8.7% |
| Interquartile 25% (IQ1) | 11.3% | 6.9% |
| Interquartile 75% (IQ3) | 20.4% | 10.5% |
| Interquartile Range (IQR) | 9.1% | 3.7% |
| Standard Deviation (Sample) | 9.1% | 6.3% |
| Standard Deviation (Population) | 9.0% | 6.3% |
Similar Demographics by Male Poverty
Demographics Similar to Spanish by Male Poverty
In terms of male poverty, the demographic groups most similar to Spanish are Immigrants from Lebanon (11.7%, a difference of 0.10%), Iraqi (11.7%, a difference of 0.11%), Spaniard (11.7%, a difference of 0.11%), Delaware (11.7%, a difference of 0.24%), and Arab (11.6%, a difference of 0.31%).
| Demographics | Rating | Rank | Male Poverty |
| Immigrants | Uruguay | 19.1 /100 | #192 | Poor 11.6% |
| Immigrants | Kuwait | 17.3 /100 | #193 | Poor 11.6% |
| Immigrants | Kenya | 16.1 /100 | #194 | Poor 11.6% |
| Arabs | 15.8 /100 | #195 | Poor 11.6% |
| Hmong | 15.8 /100 | #196 | Poor 11.6% |
| Delaware | 15.4 /100 | #197 | Poor 11.7% |
| Iraqis | 14.7 /100 | #198 | Poor 11.7% |
| Spanish | 14.1 /100 | #199 | Poor 11.7% |
| Immigrants | Lebanon | 13.6 /100 | #200 | Poor 11.7% |
| Spaniards | 13.5 /100 | #201 | Poor 11.7% |
| Aleuts | 10.4 /100 | #202 | Poor 11.8% |
| Immigrants | Western Asia | 9.8 /100 | #203 | Tragic 11.8% |
| Immigrants | Uganda | 8.5 /100 | #204 | Tragic 11.8% |
| Panamanians | 6.2 /100 | #205 | Tragic 11.9% |
| Immigrants | Eastern Africa | 5.4 /100 | #206 | Tragic 12.0% |
Demographics Similar to Germans by Male Poverty
In terms of male poverty, the demographic groups most similar to Germans are Immigrants from Bulgaria (10.1%, a difference of 0.21%), Immigrants from Austria (10.0%, a difference of 0.29%), Estonian (10.1%, a difference of 0.35%), Scandinavian (10.1%, a difference of 0.42%), and Immigrants from Europe (10.1%, a difference of 0.56%).
| Demographics | Rating | Rank | Male Poverty |
| Immigrants | Japan | 98.8 /100 | #48 | Exceptional 10.0% |
| Slovenes | 98.8 /100 | #49 | Exceptional 10.0% |
| Immigrants | Philippines | 98.7 /100 | #50 | Exceptional 10.0% |
| Immigrants | Croatia | 98.7 /100 | #51 | Exceptional 10.0% |
| Asians | 98.7 /100 | #52 | Exceptional 10.0% |
| Immigrants | Czechoslovakia | 98.6 /100 | #53 | Exceptional 10.0% |
| Immigrants | Austria | 98.5 /100 | #54 | Exceptional 10.0% |
| Germans | 98.3 /100 | #55 | Exceptional 10.1% |
| Immigrants | Bulgaria | 98.2 /100 | #56 | Exceptional 10.1% |
| Estonians | 98.1 /100 | #57 | Exceptional 10.1% |
| Scandinavians | 98.0 /100 | #58 | Exceptional 10.1% |
| Immigrants | Europe | 97.9 /100 | #59 | Exceptional 10.1% |
| Ukrainians | 97.9 /100 | #60 | Exceptional 10.1% |
| Austrians | 97.8 /100 | #61 | Exceptional 10.1% |
| Immigrants | Italy | 97.8 /100 | #62 | Exceptional 10.2% |