Spanish American Indian vs Albanian Disability
COMPARE
Spanish American Indian
Albanian
Disability
Disability Comparison
Spanish American Indians
Albanians
12.1%
DISABILITY
4.1/ 100
METRIC RATING
222nd/ 347
METRIC RANK
11.7%
DISABILITY
50.0/ 100
METRIC RATING
174th/ 347
METRIC RANK
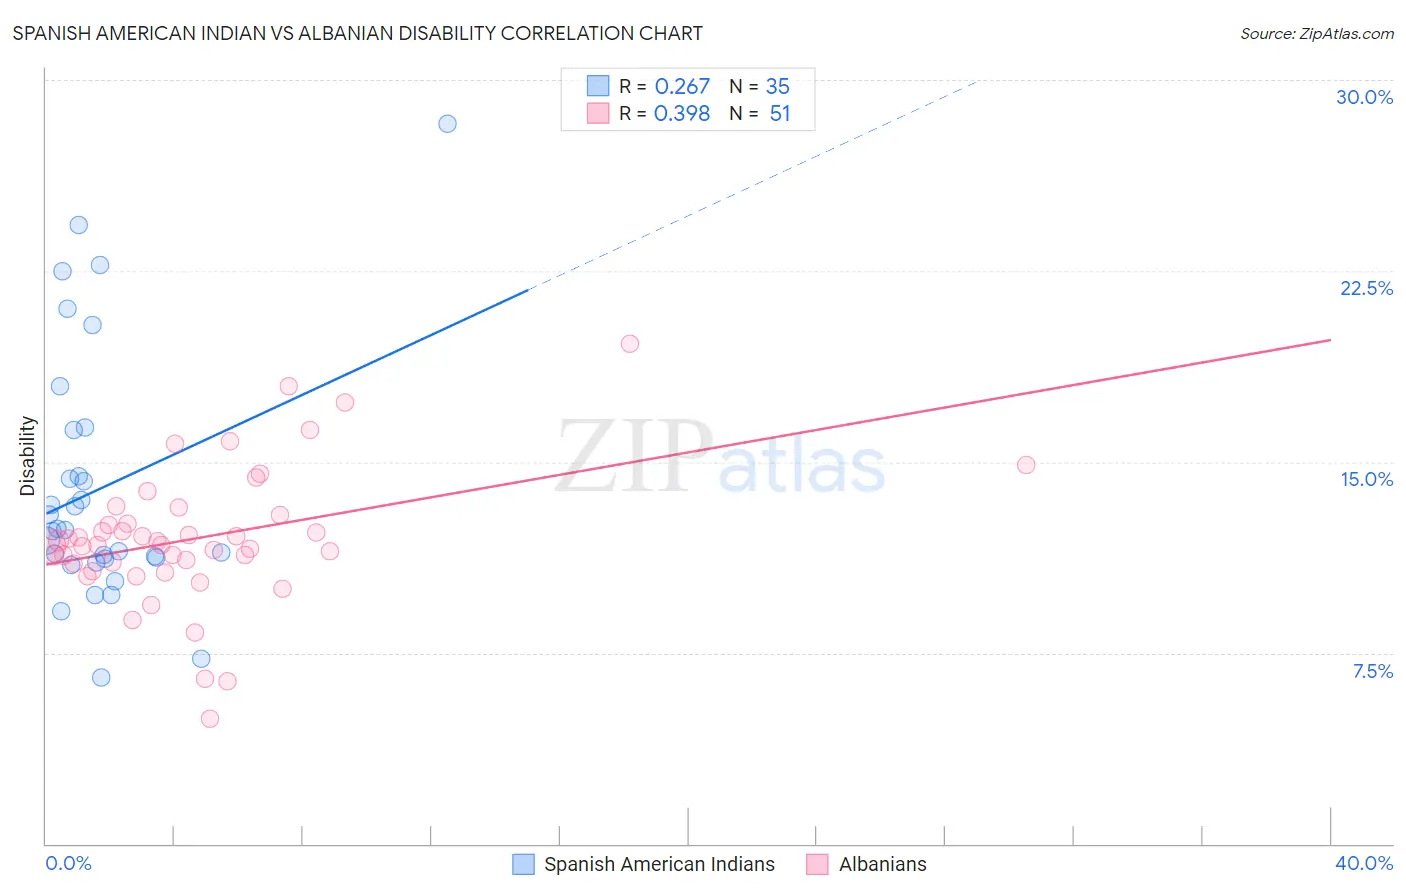
Spanish American Indian vs Albanian Disability Correlation Chart
The statistical analysis conducted on geographies consisting of 73,149,525 people shows a weak positive correlation between the proportion of Spanish American Indians and percentage of population with a disability in the United States with a correlation coefficient (R) of 0.267 and weighted average of 12.1%. Similarly, the statistical analysis conducted on geographies consisting of 193,262,883 people shows a mild positive correlation between the proportion of Albanians and percentage of population with a disability in the United States with a correlation coefficient (R) of 0.398 and weighted average of 11.7%, a difference of 3.5%.
Disability Correlation Summary
| Measurement | Spanish American Indian | Albanian |
| Minimum | 6.5% | 4.9% |
| Maximum | 28.3% | 19.7% |
| Range | 21.7% | 14.8% |
| Mean | 14.0% | 12.0% |
| Median | 12.3% | 11.7% |
| Interquartile 25% (IQ1) | 11.2% | 11.0% |
| Interquartile 75% (IQ3) | 16.3% | 12.9% |
| Interquartile Range (IQR) | 5.1% | 1.9% |
| Standard Deviation (Sample) | 4.9% | 2.7% |
| Standard Deviation (Population) | 4.9% | 2.7% |
Similar Demographics by Disability
Demographics Similar to Spanish American Indians by Disability
In terms of disability, the demographic groups most similar to Spanish American Indians are Northern European (12.1%, a difference of 0.040%), Hispanic or Latino (12.1%, a difference of 0.040%), Mexican (12.1%, a difference of 0.10%), Immigrants from Bahamas (12.1%, a difference of 0.16%), and Senegalese (12.1%, a difference of 0.18%).
| Demographics | Rating | Rank | Disability |
| Immigrants | Canada | 6.1 /100 | #215 | Tragic 12.1% |
| Panamanians | 5.4 /100 | #216 | Tragic 12.1% |
| Immigrants | North America | 5.3 /100 | #217 | Tragic 12.1% |
| Immigrants | Jamaica | 5.0 /100 | #218 | Tragic 12.1% |
| Croatians | 4.9 /100 | #219 | Tragic 12.1% |
| Immigrants | Bahamas | 4.7 /100 | #220 | Tragic 12.1% |
| Northern Europeans | 4.2 /100 | #221 | Tragic 12.1% |
| Spanish American Indians | 4.1 /100 | #222 | Tragic 12.1% |
| Hispanics or Latinos | 3.9 /100 | #223 | Tragic 12.1% |
| Mexicans | 3.7 /100 | #224 | Tragic 12.1% |
| Senegalese | 3.5 /100 | #225 | Tragic 12.1% |
| Jamaicans | 3.3 /100 | #226 | Tragic 12.1% |
| Alsatians | 3.3 /100 | #227 | Tragic 12.1% |
| West Indians | 2.9 /100 | #228 | Tragic 12.2% |
| Inupiat | 2.8 /100 | #229 | Tragic 12.2% |
Demographics Similar to Albanians by Disability
In terms of disability, the demographic groups most similar to Albanians are Maltese (11.7%, a difference of 0.030%), Haitian (11.7%, a difference of 0.060%), Immigrants from Western Africa (11.7%, a difference of 0.11%), Immigrants from Albania (11.7%, a difference of 0.12%), and Immigrants from Southern Europe (11.7%, a difference of 0.12%).
| Demographics | Rating | Rank | Disability |
| Estonians | 54.4 /100 | #167 | Average 11.7% |
| Immigrants | Latin America | 54.1 /100 | #168 | Average 11.7% |
| Immigrants | Austria | 53.4 /100 | #169 | Average 11.7% |
| Immigrants | Albania | 52.8 /100 | #170 | Average 11.7% |
| Immigrants | Southern Europe | 52.8 /100 | #171 | Average 11.7% |
| Trinidadians and Tobagonians | 52.7 /100 | #172 | Average 11.7% |
| Maltese | 50.6 /100 | #173 | Average 11.7% |
| Albanians | 50.0 /100 | #174 | Average 11.7% |
| Haitians | 48.6 /100 | #175 | Average 11.7% |
| Immigrants | Western Africa | 47.5 /100 | #176 | Average 11.7% |
| Immigrants | Central America | 46.6 /100 | #177 | Average 11.7% |
| Greeks | 46.2 /100 | #178 | Average 11.7% |
| Immigrants | Armenia | 41.9 /100 | #179 | Average 11.7% |
| Immigrants | Honduras | 37.8 /100 | #180 | Fair 11.8% |
| Immigrants | Oceania | 34.3 /100 | #181 | Fair 11.8% |