Spaniard vs Ute Disability Age 5 to 17
COMPARE
Spaniard
Ute
Disability Age 5 to 17
Disability Age 5 to 17 Comparison
Spaniards
Ute
5.9%
DISABILITY AGE 5 TO 17
2.0/ 100
METRIC RATING
242nd/ 347
METRIC RANK
5.5%
DISABILITY AGE 5 TO 17
80.6/ 100
METRIC RATING
152nd/ 347
METRIC RANK
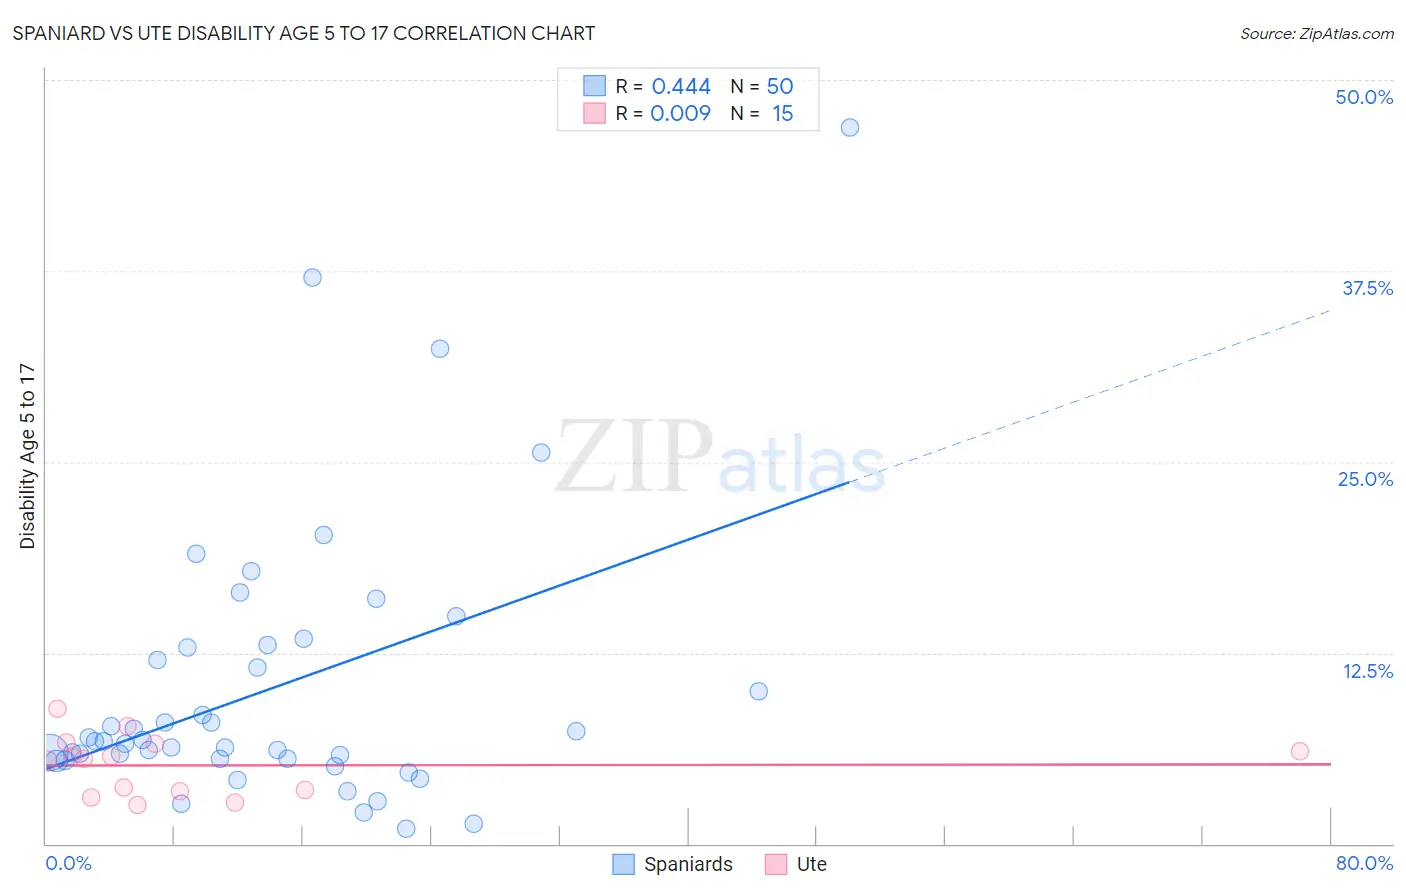
Spaniard vs Ute Disability Age 5 to 17 Correlation Chart
The statistical analysis conducted on geographies consisting of 438,849,773 people shows a moderate positive correlation between the proportion of Spaniards and percentage of population with a disability between the ages 5 and 17 in the United States with a correlation coefficient (R) of 0.444 and weighted average of 5.9%. Similarly, the statistical analysis conducted on geographies consisting of 55,569,017 people shows no correlation between the proportion of Ute and percentage of population with a disability between the ages 5 and 17 in the United States with a correlation coefficient (R) of 0.009 and weighted average of 5.5%, a difference of 6.7%.
Disability Age 5 to 17 Correlation Summary
| Measurement | Spaniard | Ute |
| Minimum | 0.99% | 2.5% |
| Maximum | 46.9% | 8.8% |
| Range | 45.9% | 6.3% |
| Mean | 10.2% | 5.1% |
| Median | 6.7% | 5.6% |
| Interquartile 25% (IQ1) | 5.6% | 3.4% |
| Interquartile 75% (IQ3) | 12.9% | 6.5% |
| Interquartile Range (IQR) | 7.3% | 3.1% |
| Standard Deviation (Sample) | 9.0% | 1.9% |
| Standard Deviation (Population) | 9.0% | 1.8% |
Similar Demographics by Disability Age 5 to 17
Demographics Similar to Spaniards by Disability Age 5 to 17
In terms of disability age 5 to 17, the demographic groups most similar to Spaniards are Indonesian (5.9%, a difference of 0.010%), Immigrants from Germany (5.9%, a difference of 0.070%), Immigrants from Micronesia (5.9%, a difference of 0.070%), Immigrants from Caribbean (5.9%, a difference of 0.080%), and Tlingit-Haida (5.9%, a difference of 0.080%).
| Demographics | Rating | Rank | Disability Age 5 to 17 |
| Malaysians | 3.4 /100 | #235 | Tragic 5.8% |
| Immigrants | Brazil | 3.2 /100 | #236 | Tragic 5.8% |
| Sudanese | 2.9 /100 | #237 | Tragic 5.8% |
| Hungarians | 2.6 /100 | #238 | Tragic 5.8% |
| German Russians | 2.4 /100 | #239 | Tragic 5.9% |
| West Indians | 2.4 /100 | #240 | Tragic 5.9% |
| Immigrants | Caribbean | 2.1 /100 | #241 | Tragic 5.9% |
| Spaniards | 2.0 /100 | #242 | Tragic 5.9% |
| Indonesians | 2.0 /100 | #243 | Tragic 5.9% |
| Immigrants | Germany | 1.9 /100 | #244 | Tragic 5.9% |
| Immigrants | Micronesia | 1.9 /100 | #245 | Tragic 5.9% |
| Tlingit-Haida | 1.9 /100 | #246 | Tragic 5.9% |
| Immigrants | Honduras | 1.8 /100 | #247 | Tragic 5.9% |
| British | 1.7 /100 | #248 | Tragic 5.9% |
| Immigrants | Ghana | 1.7 /100 | #249 | Tragic 5.9% |
Demographics Similar to Ute by Disability Age 5 to 17
In terms of disability age 5 to 17, the demographic groups most similar to Ute are Estonian (5.5%, a difference of 0.010%), Guatemalan (5.5%, a difference of 0.070%), Ecuadorian (5.5%, a difference of 0.070%), Central American (5.5%, a difference of 0.080%), and Samoan (5.5%, a difference of 0.11%).
| Demographics | Rating | Rank | Disability Age 5 to 17 |
| Immigrants | Guatemala | 86.6 /100 | #145 | Excellent 5.5% |
| Albanians | 83.7 /100 | #146 | Excellent 5.5% |
| Immigrants | Albania | 83.1 /100 | #147 | Excellent 5.5% |
| Samoans | 81.9 /100 | #148 | Excellent 5.5% |
| Central Americans | 81.6 /100 | #149 | Excellent 5.5% |
| Guatemalans | 81.5 /100 | #150 | Excellent 5.5% |
| Estonians | 80.8 /100 | #151 | Excellent 5.5% |
| Ute | 80.6 /100 | #152 | Excellent 5.5% |
| Ecuadorians | 79.7 /100 | #153 | Good 5.5% |
| Australians | 78.8 /100 | #154 | Good 5.5% |
| Immigrants | Ecuador | 78.3 /100 | #155 | Good 5.5% |
| Hawaiians | 78.0 /100 | #156 | Good 5.5% |
| Immigrants | Costa Rica | 77.9 /100 | #157 | Good 5.5% |
| Immigrants | Nepal | 77.1 /100 | #158 | Good 5.5% |
| Immigrants | Zimbabwe | 75.3 /100 | #159 | Good 5.5% |