Spaniard vs Immigrants from Iran Disability Age 5 to 17
COMPARE
Spaniard
Immigrants from Iran
Disability Age 5 to 17
Disability Age 5 to 17 Comparison
Spaniards
Immigrants from Iran
5.9%
DISABILITY AGE 5 TO 17
2.0/ 100
METRIC RATING
242nd/ 347
METRIC RANK
4.4%
DISABILITY AGE 5 TO 17
100.0/ 100
METRIC RATING
5th/ 347
METRIC RANK
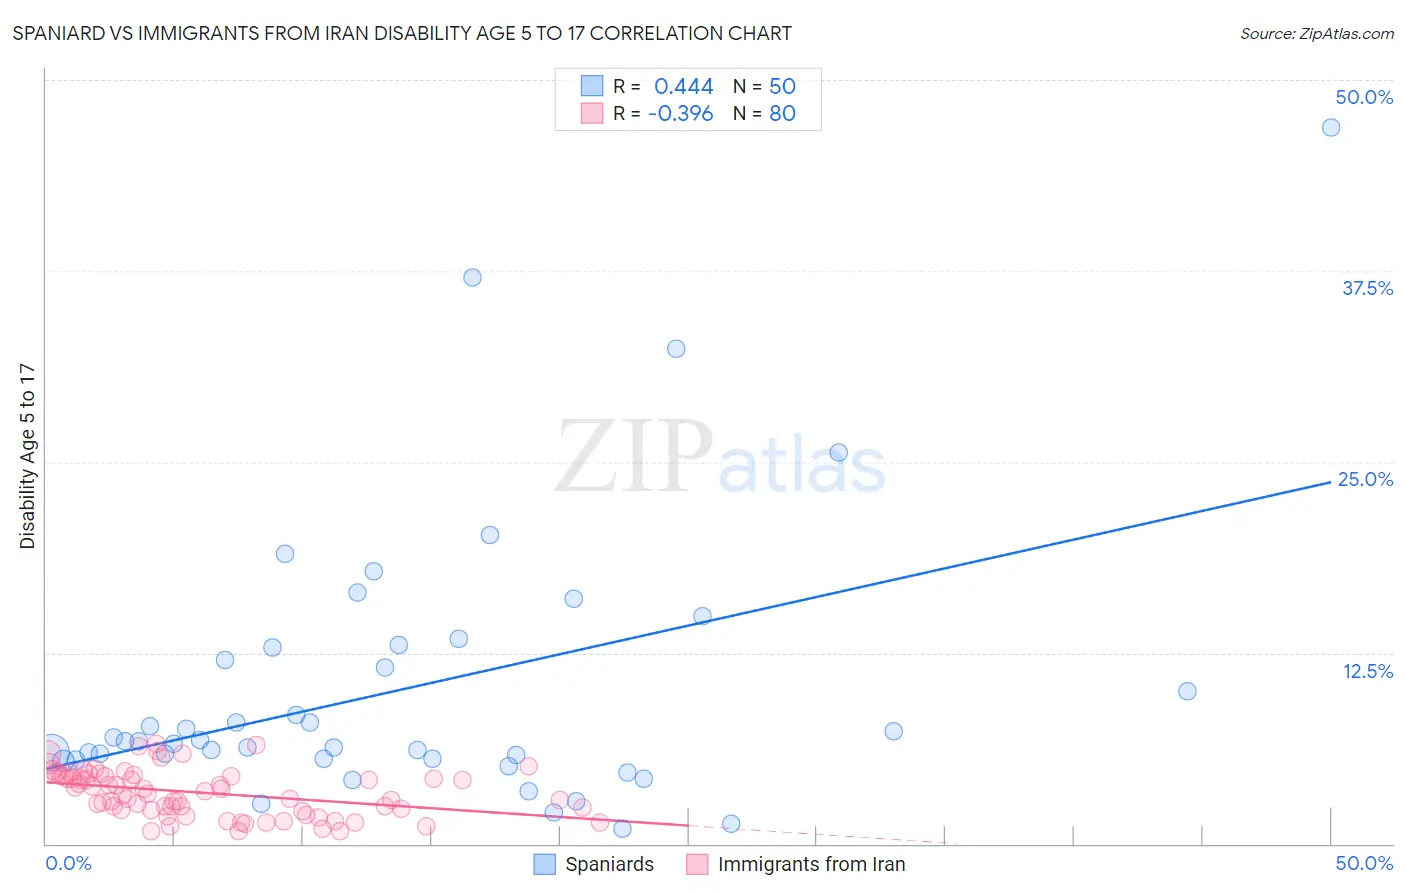
Spaniard vs Immigrants from Iran Disability Age 5 to 17 Correlation Chart
The statistical analysis conducted on geographies consisting of 438,849,773 people shows a moderate positive correlation between the proportion of Spaniards and percentage of population with a disability between the ages 5 and 17 in the United States with a correlation coefficient (R) of 0.444 and weighted average of 5.9%. Similarly, the statistical analysis conducted on geographies consisting of 278,151,157 people shows a mild negative correlation between the proportion of Immigrants from Iran and percentage of population with a disability between the ages 5 and 17 in the United States with a correlation coefficient (R) of -0.396 and weighted average of 4.4%, a difference of 34.5%.
Disability Age 5 to 17 Correlation Summary
| Measurement | Spaniard | Immigrants from Iran |
| Minimum | 0.99% | 0.81% |
| Maximum | 46.9% | 6.5% |
| Range | 45.9% | 5.7% |
| Mean | 10.2% | 3.3% |
| Median | 6.7% | 3.4% |
| Interquartile 25% (IQ1) | 5.6% | 2.2% |
| Interquartile 75% (IQ3) | 12.9% | 4.4% |
| Interquartile Range (IQR) | 7.3% | 2.2% |
| Standard Deviation (Sample) | 9.0% | 1.5% |
| Standard Deviation (Population) | 9.0% | 1.5% |
Similar Demographics by Disability Age 5 to 17
Demographics Similar to Spaniards by Disability Age 5 to 17
In terms of disability age 5 to 17, the demographic groups most similar to Spaniards are Indonesian (5.9%, a difference of 0.010%), Immigrants from Germany (5.9%, a difference of 0.070%), Immigrants from Micronesia (5.9%, a difference of 0.070%), Immigrants from Caribbean (5.9%, a difference of 0.080%), and Tlingit-Haida (5.9%, a difference of 0.080%).
| Demographics | Rating | Rank | Disability Age 5 to 17 |
| Malaysians | 3.4 /100 | #235 | Tragic 5.8% |
| Immigrants | Brazil | 3.2 /100 | #236 | Tragic 5.8% |
| Sudanese | 2.9 /100 | #237 | Tragic 5.8% |
| Hungarians | 2.6 /100 | #238 | Tragic 5.8% |
| German Russians | 2.4 /100 | #239 | Tragic 5.9% |
| West Indians | 2.4 /100 | #240 | Tragic 5.9% |
| Immigrants | Caribbean | 2.1 /100 | #241 | Tragic 5.9% |
| Spaniards | 2.0 /100 | #242 | Tragic 5.9% |
| Indonesians | 2.0 /100 | #243 | Tragic 5.9% |
| Immigrants | Germany | 1.9 /100 | #244 | Tragic 5.9% |
| Immigrants | Micronesia | 1.9 /100 | #245 | Tragic 5.9% |
| Tlingit-Haida | 1.9 /100 | #246 | Tragic 5.9% |
| Immigrants | Honduras | 1.8 /100 | #247 | Tragic 5.9% |
| British | 1.7 /100 | #248 | Tragic 5.9% |
| Immigrants | Ghana | 1.7 /100 | #249 | Tragic 5.9% |
Demographics Similar to Immigrants from Iran by Disability Age 5 to 17
In terms of disability age 5 to 17, the demographic groups most similar to Immigrants from Iran are Filipino (4.3%, a difference of 0.55%), Immigrants from Hong Kong (4.3%, a difference of 1.5%), Immigrants from Israel (4.5%, a difference of 3.4%), Immigrants from China (4.5%, a difference of 3.7%), and Immigrants from Taiwan (4.2%, a difference of 4.1%).
| Demographics | Rating | Rank | Disability Age 5 to 17 |
| Immigrants | Armenia | 100.0 /100 | #1 | Exceptional 4.1% |
| Immigrants | Taiwan | 100.0 /100 | #2 | Exceptional 4.2% |
| Immigrants | Hong Kong | 100.0 /100 | #3 | Exceptional 4.3% |
| Filipinos | 100.0 /100 | #4 | Exceptional 4.3% |
| Immigrants | Iran | 100.0 /100 | #5 | Exceptional 4.4% |
| Immigrants | Israel | 100.0 /100 | #6 | Exceptional 4.5% |
| Immigrants | China | 100.0 /100 | #7 | Exceptional 4.5% |
| Indians (Asian) | 100.0 /100 | #8 | Exceptional 4.6% |
| Immigrants | Eastern Asia | 100.0 /100 | #9 | Exceptional 4.6% |
| Immigrants | India | 100.0 /100 | #10 | Exceptional 4.6% |
| Armenians | 100.0 /100 | #11 | Exceptional 4.6% |
| Iranians | 100.0 /100 | #12 | Exceptional 4.6% |
| Thais | 100.0 /100 | #13 | Exceptional 4.7% |
| Immigrants | Korea | 100.0 /100 | #14 | Exceptional 4.7% |
| Chinese | 100.0 /100 | #15 | Exceptional 4.7% |