Spaniard vs Immigrants from Scotland Cognitive Disability
COMPARE
Spaniard
Immigrants from Scotland
Cognitive Disability
Cognitive Disability Comparison
Spaniards
Immigrants from Scotland
17.3%
COGNITIVE DISABILITY
40.3/ 100
METRIC RATING
183rd/ 347
METRIC RANK
16.2%
COGNITIVE DISABILITY
100.0/ 100
METRIC RATING
10th/ 347
METRIC RANK
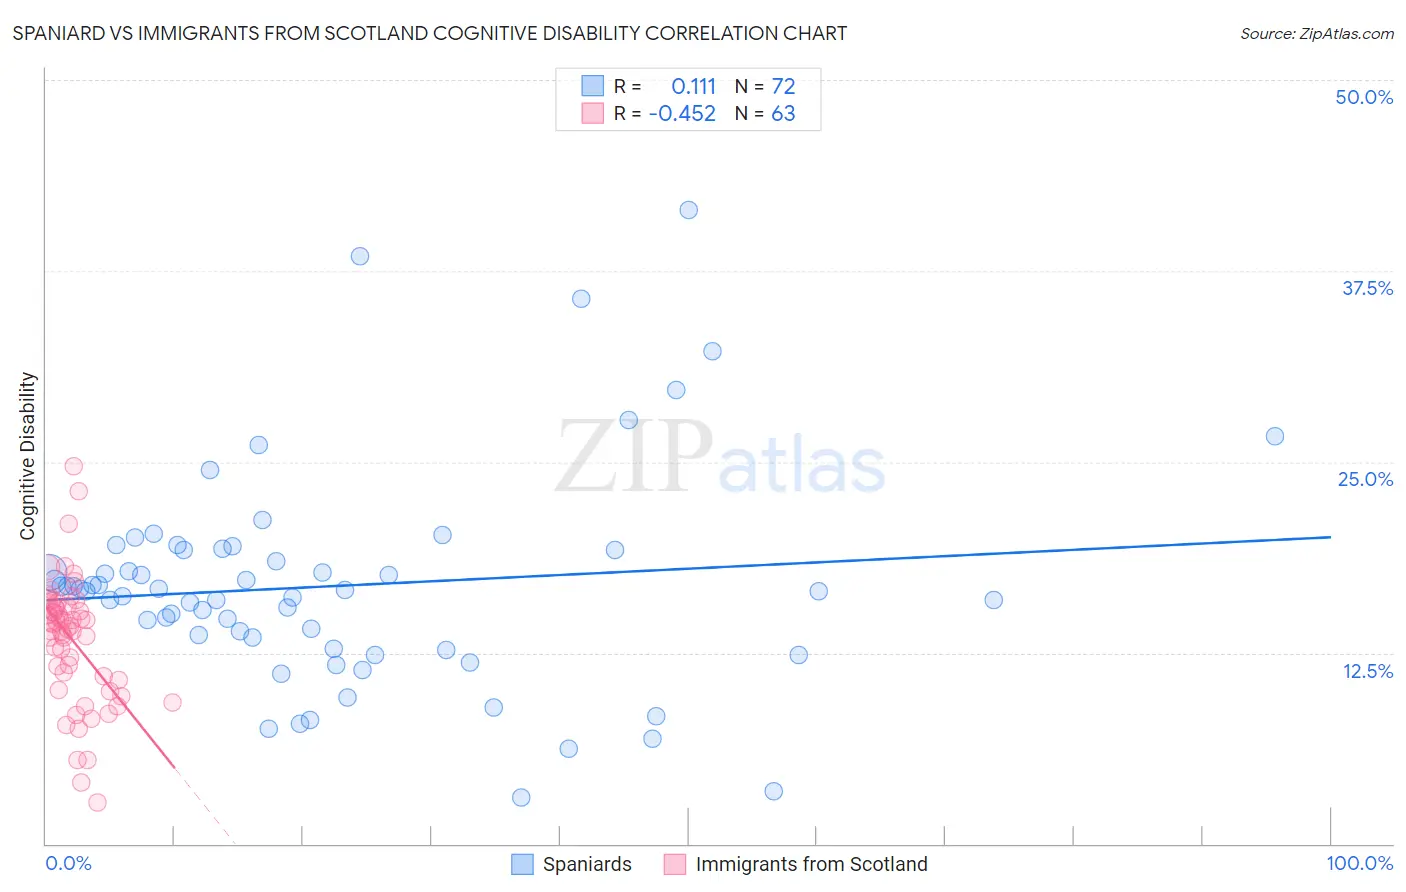
Spaniard vs Immigrants from Scotland Cognitive Disability Correlation Chart
The statistical analysis conducted on geographies consisting of 443,445,256 people shows a poor positive correlation between the proportion of Spaniards and percentage of population with cognitive disability in the United States with a correlation coefficient (R) of 0.111 and weighted average of 17.3%. Similarly, the statistical analysis conducted on geographies consisting of 196,398,604 people shows a moderate negative correlation between the proportion of Immigrants from Scotland and percentage of population with cognitive disability in the United States with a correlation coefficient (R) of -0.452 and weighted average of 16.2%, a difference of 7.0%.
Cognitive Disability Correlation Summary
| Measurement | Spaniard | Immigrants from Scotland |
| Minimum | 3.0% | 2.7% |
| Maximum | 41.5% | 24.7% |
| Range | 38.5% | 22.0% |
| Mean | 16.9% | 13.3% |
| Median | 16.6% | 14.3% |
| Interquartile 25% (IQ1) | 13.1% | 10.7% |
| Interquartile 75% (IQ3) | 19.2% | 15.5% |
| Interquartile Range (IQR) | 6.1% | 4.8% |
| Standard Deviation (Sample) | 7.1% | 4.1% |
| Standard Deviation (Population) | 7.0% | 4.1% |
Similar Demographics by Cognitive Disability
Demographics Similar to Spaniards by Cognitive Disability
In terms of cognitive disability, the demographic groups most similar to Spaniards are Crow (17.3%, a difference of 0.040%), Afghan (17.3%, a difference of 0.060%), Immigrants from Guyana (17.3%, a difference of 0.070%), Arab (17.3%, a difference of 0.070%), and Pakistani (17.3%, a difference of 0.10%).
| Demographics | Rating | Rank | Cognitive Disability |
| Shoshone | 49.2 /100 | #176 | Average 17.3% |
| Ute | 49.1 /100 | #177 | Average 17.3% |
| Spanish | 48.9 /100 | #178 | Average 17.3% |
| Sioux | 48.6 /100 | #179 | Average 17.3% |
| Pakistanis | 43.9 /100 | #180 | Average 17.3% |
| Immigrants | Guyana | 42.9 /100 | #181 | Average 17.3% |
| Arabs | 42.8 /100 | #182 | Average 17.3% |
| Spaniards | 40.3 /100 | #183 | Average 17.3% |
| Crow | 39.1 /100 | #184 | Fair 17.3% |
| Afghans | 38.2 /100 | #185 | Fair 17.3% |
| Cambodians | 35.9 /100 | #186 | Fair 17.3% |
| Immigrants | Fiji | 33.7 /100 | #187 | Fair 17.4% |
| Immigrants | France | 29.8 /100 | #188 | Fair 17.4% |
| Immigrants | Western Asia | 29.5 /100 | #189 | Fair 17.4% |
| Immigrants | Spain | 27.7 /100 | #190 | Fair 17.4% |
Demographics Similar to Immigrants from Scotland by Cognitive Disability
In terms of cognitive disability, the demographic groups most similar to Immigrants from Scotland are Assyrian/Chaldean/Syriac (16.2%, a difference of 0.040%), Immigrants from Czechoslovakia (16.2%, a difference of 0.080%), Maltese (16.2%, a difference of 0.25%), Lithuanian (16.3%, a difference of 0.34%), and Immigrants from Poland (16.1%, a difference of 0.36%).
| Demographics | Rating | Rank | Cognitive Disability |
| Chinese | 100.0 /100 | #3 | Exceptional 15.9% |
| Immigrants | Lithuania | 100.0 /100 | #4 | Exceptional 16.0% |
| Immigrants | Hong Kong | 100.0 /100 | #5 | Exceptional 16.0% |
| Thais | 100.0 /100 | #6 | Exceptional 16.1% |
| Immigrants | Ireland | 100.0 /100 | #7 | Exceptional 16.1% |
| Immigrants | Poland | 100.0 /100 | #8 | Exceptional 16.1% |
| Assyrians/Chaldeans/Syriacs | 100.0 /100 | #9 | Exceptional 16.2% |
| Immigrants | Scotland | 100.0 /100 | #10 | Exceptional 16.2% |
| Immigrants | Czechoslovakia | 100.0 /100 | #11 | Exceptional 16.2% |
| Maltese | 100.0 /100 | #12 | Exceptional 16.2% |
| Lithuanians | 100.0 /100 | #13 | Exceptional 16.3% |
| Immigrants | Austria | 100.0 /100 | #14 | Exceptional 16.3% |
| Immigrants | Greece | 100.0 /100 | #15 | Exceptional 16.3% |
| Eastern Europeans | 100.0 /100 | #16 | Exceptional 16.3% |
| Immigrants | North Macedonia | 100.0 /100 | #17 | Exceptional 16.3% |