Chilean vs Immigrants from Scotland Cognitive Disability
COMPARE
Chilean
Immigrants from Scotland
Cognitive Disability
Cognitive Disability Comparison
Chileans
Immigrants from Scotland
17.0%
COGNITIVE DISABILITY
89.9/ 100
METRIC RATING
140th/ 347
METRIC RANK
16.2%
COGNITIVE DISABILITY
100.0/ 100
METRIC RATING
10th/ 347
METRIC RANK
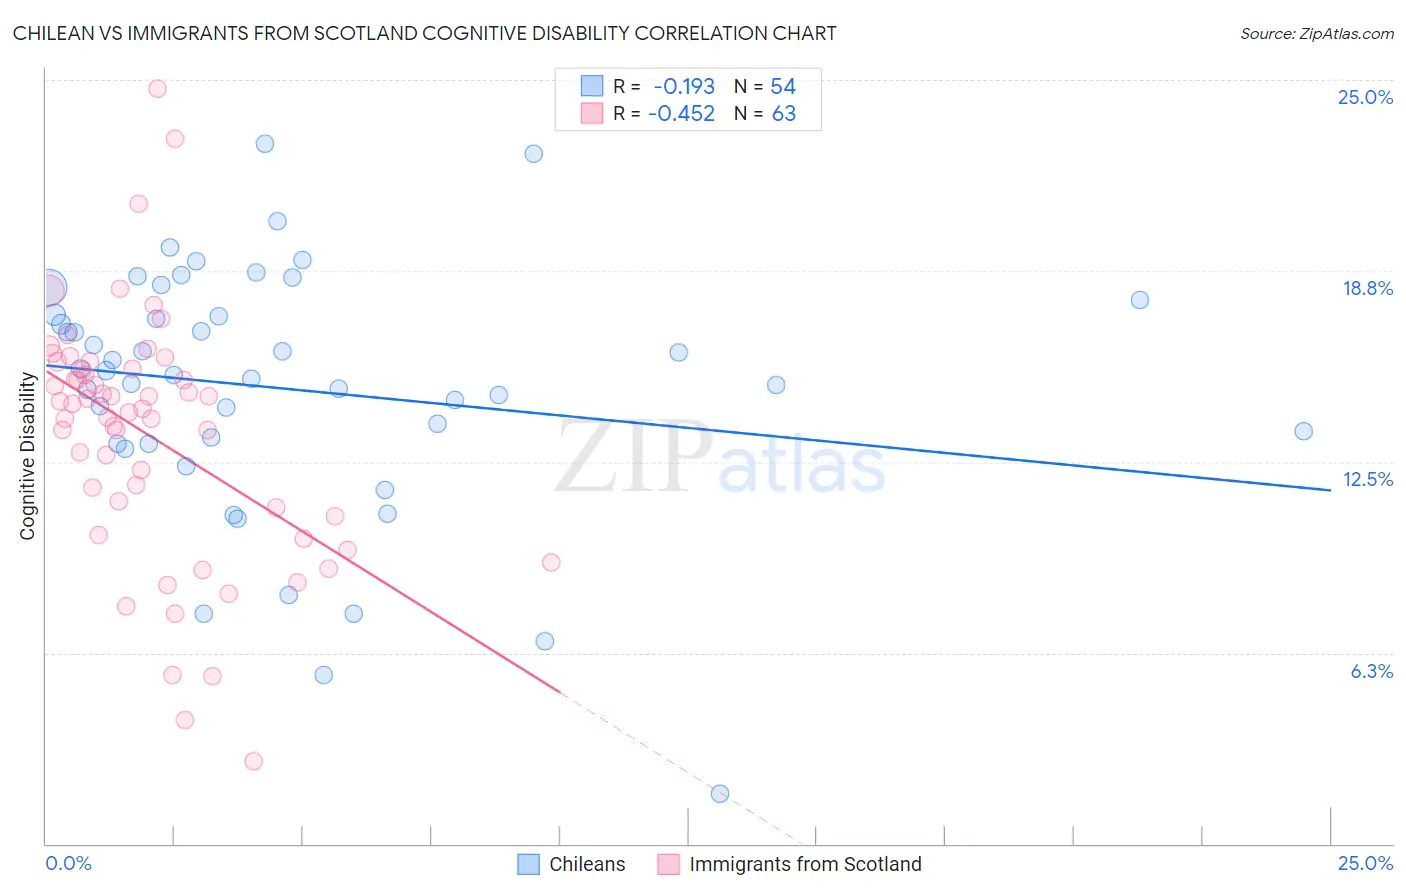
Chilean vs Immigrants from Scotland Cognitive Disability Correlation Chart
The statistical analysis conducted on geographies consisting of 256,654,353 people shows a poor negative correlation between the proportion of Chileans and percentage of population with cognitive disability in the United States with a correlation coefficient (R) of -0.193 and weighted average of 17.0%. Similarly, the statistical analysis conducted on geographies consisting of 196,398,604 people shows a moderate negative correlation between the proportion of Immigrants from Scotland and percentage of population with cognitive disability in the United States with a correlation coefficient (R) of -0.452 and weighted average of 16.2%, a difference of 5.0%.
Cognitive Disability Correlation Summary
| Measurement | Chilean | Immigrants from Scotland |
| Minimum | 1.6% | 2.7% |
| Maximum | 22.9% | 24.7% |
| Range | 21.3% | 22.0% |
| Mean | 14.9% | 13.3% |
| Median | 15.4% | 14.3% |
| Interquartile 25% (IQ1) | 13.1% | 10.7% |
| Interquartile 75% (IQ3) | 17.3% | 15.5% |
| Interquartile Range (IQR) | 4.2% | 4.8% |
| Standard Deviation (Sample) | 4.1% | 4.1% |
| Standard Deviation (Population) | 4.1% | 4.1% |
Similar Demographics by Cognitive Disability
Demographics Similar to Chileans by Cognitive Disability
In terms of cognitive disability, the demographic groups most similar to Chileans are French (17.0%, a difference of 0.0%), Aleut (17.0%, a difference of 0.0%), Carpatho Rusyn (17.0%, a difference of 0.030%), British (17.0%, a difference of 0.050%), and Immigrants from Brazil (17.0%, a difference of 0.050%).
| Demographics | Rating | Rank | Cognitive Disability |
| Immigrants | Jordan | 91.9 /100 | #133 | Exceptional 17.0% |
| Immigrants | Chile | 91.7 /100 | #134 | Exceptional 17.0% |
| Lebanese | 91.3 /100 | #135 | Exceptional 17.0% |
| Israelis | 91.0 /100 | #136 | Exceptional 17.0% |
| Immigrants | Norway | 90.9 /100 | #137 | Exceptional 17.0% |
| Welsh | 90.8 /100 | #138 | Exceptional 17.0% |
| French | 90.0 /100 | #139 | Excellent 17.0% |
| Chileans | 89.9 /100 | #140 | Excellent 17.0% |
| Aleuts | 89.9 /100 | #141 | Excellent 17.0% |
| Carpatho Rusyns | 89.6 /100 | #142 | Excellent 17.0% |
| British | 89.3 /100 | #143 | Excellent 17.0% |
| Immigrants | Brazil | 89.3 /100 | #144 | Excellent 17.0% |
| Immigrants | South Eastern Asia | 88.7 /100 | #145 | Excellent 17.0% |
| Costa Ricans | 88.0 /100 | #146 | Excellent 17.0% |
| Scotch-Irish | 85.9 /100 | #147 | Excellent 17.1% |
Demographics Similar to Immigrants from Scotland by Cognitive Disability
In terms of cognitive disability, the demographic groups most similar to Immigrants from Scotland are Assyrian/Chaldean/Syriac (16.2%, a difference of 0.040%), Immigrants from Czechoslovakia (16.2%, a difference of 0.080%), Maltese (16.2%, a difference of 0.25%), Lithuanian (16.3%, a difference of 0.34%), and Immigrants from Poland (16.1%, a difference of 0.36%).
| Demographics | Rating | Rank | Cognitive Disability |
| Chinese | 100.0 /100 | #3 | Exceptional 15.9% |
| Immigrants | Lithuania | 100.0 /100 | #4 | Exceptional 16.0% |
| Immigrants | Hong Kong | 100.0 /100 | #5 | Exceptional 16.0% |
| Thais | 100.0 /100 | #6 | Exceptional 16.1% |
| Immigrants | Ireland | 100.0 /100 | #7 | Exceptional 16.1% |
| Immigrants | Poland | 100.0 /100 | #8 | Exceptional 16.1% |
| Assyrians/Chaldeans/Syriacs | 100.0 /100 | #9 | Exceptional 16.2% |
| Immigrants | Scotland | 100.0 /100 | #10 | Exceptional 16.2% |
| Immigrants | Czechoslovakia | 100.0 /100 | #11 | Exceptional 16.2% |
| Maltese | 100.0 /100 | #12 | Exceptional 16.2% |
| Lithuanians | 100.0 /100 | #13 | Exceptional 16.3% |
| Immigrants | Austria | 100.0 /100 | #14 | Exceptional 16.3% |
| Immigrants | Greece | 100.0 /100 | #15 | Exceptional 16.3% |
| Eastern Europeans | 100.0 /100 | #16 | Exceptional 16.3% |
| Immigrants | North Macedonia | 100.0 /100 | #17 | Exceptional 16.3% |