Spaniard vs Spanish American Indian Cognitive Disability
COMPARE
Spaniard
Spanish American Indian
Cognitive Disability
Cognitive Disability Comparison
Spaniards
Spanish American Indians
17.3%
COGNITIVE DISABILITY
40.3/ 100
METRIC RATING
183rd/ 347
METRIC RANK
17.8%
COGNITIVE DISABILITY
2.0/ 100
METRIC RATING
235th/ 347
METRIC RANK
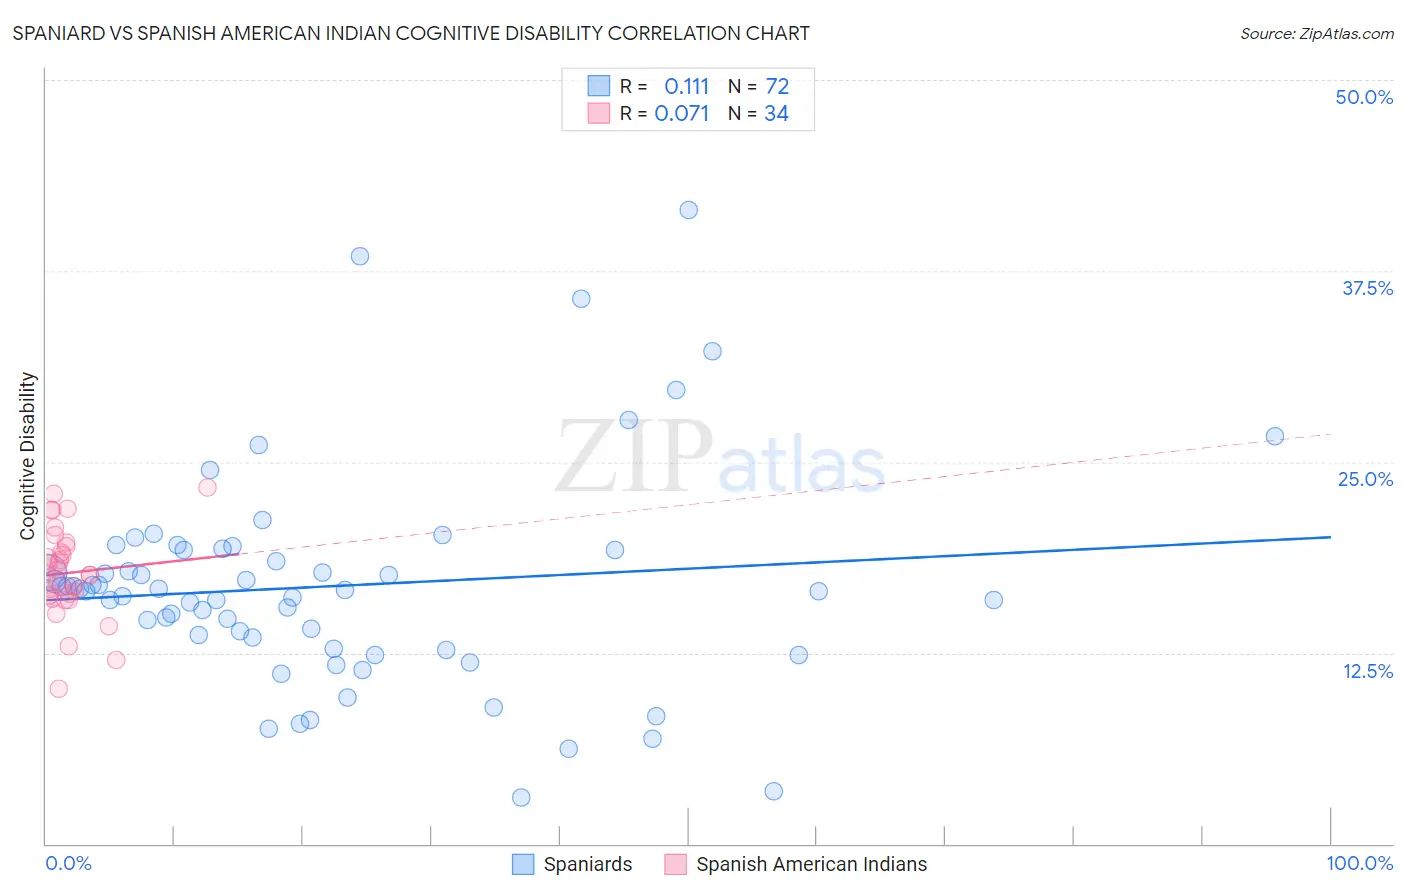
Spaniard vs Spanish American Indian Cognitive Disability Correlation Chart
The statistical analysis conducted on geographies consisting of 443,445,256 people shows a poor positive correlation between the proportion of Spaniards and percentage of population with cognitive disability in the United States with a correlation coefficient (R) of 0.111 and weighted average of 17.3%. Similarly, the statistical analysis conducted on geographies consisting of 73,150,113 people shows a slight positive correlation between the proportion of Spanish American Indians and percentage of population with cognitive disability in the United States with a correlation coefficient (R) of 0.071 and weighted average of 17.8%, a difference of 2.5%.
Cognitive Disability Correlation Summary
| Measurement | Spaniard | Spanish American Indian |
| Minimum | 3.0% | 10.1% |
| Maximum | 41.5% | 23.4% |
| Range | 38.5% | 13.2% |
| Mean | 16.9% | 17.7% |
| Median | 16.6% | 17.6% |
| Interquartile 25% (IQ1) | 13.1% | 16.2% |
| Interquartile 75% (IQ3) | 19.2% | 19.4% |
| Interquartile Range (IQR) | 6.1% | 3.3% |
| Standard Deviation (Sample) | 7.1% | 3.0% |
| Standard Deviation (Population) | 7.0% | 2.9% |
Similar Demographics by Cognitive Disability
Demographics Similar to Spaniards by Cognitive Disability
In terms of cognitive disability, the demographic groups most similar to Spaniards are Crow (17.3%, a difference of 0.040%), Afghan (17.3%, a difference of 0.060%), Immigrants from Guyana (17.3%, a difference of 0.070%), Arab (17.3%, a difference of 0.070%), and Pakistani (17.3%, a difference of 0.10%).
| Demographics | Rating | Rank | Cognitive Disability |
| Shoshone | 49.2 /100 | #176 | Average 17.3% |
| Ute | 49.1 /100 | #177 | Average 17.3% |
| Spanish | 48.9 /100 | #178 | Average 17.3% |
| Sioux | 48.6 /100 | #179 | Average 17.3% |
| Pakistanis | 43.9 /100 | #180 | Average 17.3% |
| Immigrants | Guyana | 42.9 /100 | #181 | Average 17.3% |
| Arabs | 42.8 /100 | #182 | Average 17.3% |
| Spaniards | 40.3 /100 | #183 | Average 17.3% |
| Crow | 39.1 /100 | #184 | Fair 17.3% |
| Afghans | 38.2 /100 | #185 | Fair 17.3% |
| Cambodians | 35.9 /100 | #186 | Fair 17.3% |
| Immigrants | Fiji | 33.7 /100 | #187 | Fair 17.4% |
| Immigrants | France | 29.8 /100 | #188 | Fair 17.4% |
| Immigrants | Western Asia | 29.5 /100 | #189 | Fair 17.4% |
| Immigrants | Spain | 27.7 /100 | #190 | Fair 17.4% |
Demographics Similar to Spanish American Indians by Cognitive Disability
In terms of cognitive disability, the demographic groups most similar to Spanish American Indians are Osage (17.8%, a difference of 0.0%), Guatemalan (17.8%, a difference of 0.020%), Tongan (17.8%, a difference of 0.020%), Panamanian (17.8%, a difference of 0.020%), and Mongolian (17.7%, a difference of 0.060%).
| Demographics | Rating | Rank | Cognitive Disability |
| Immigrants | Central America | 2.3 /100 | #228 | Tragic 17.7% |
| Immigrants | Guatemala | 2.2 /100 | #229 | Tragic 17.7% |
| Mongolians | 2.2 /100 | #230 | Tragic 17.7% |
| Guatemalans | 2.1 /100 | #231 | Tragic 17.8% |
| Tongans | 2.1 /100 | #232 | Tragic 17.8% |
| Panamanians | 2.1 /100 | #233 | Tragic 17.8% |
| Osage | 2.0 /100 | #234 | Tragic 17.8% |
| Spanish American Indians | 2.0 /100 | #235 | Tragic 17.8% |
| Immigrants | Iraq | 1.8 /100 | #236 | Tragic 17.8% |
| Immigrants | Mexico | 1.8 /100 | #237 | Tragic 17.8% |
| Cheyenne | 1.7 /100 | #238 | Tragic 17.8% |
| Cajuns | 1.4 /100 | #239 | Tragic 17.8% |
| Iraqis | 1.4 /100 | #240 | Tragic 17.8% |
| Mexicans | 1.1 /100 | #241 | Tragic 17.8% |
| Paiute | 1.1 /100 | #242 | Tragic 17.8% |